Category:Sex differences in human life expectancy
Media in category "Sex differences in human life expectancy"
The following 44 files are in this category, out of 44 total.
-
 20200101 Life expectancy increases with age already achieved - chart.svg 1,000 × 750; 9 KB
-
 20200101 Remaining life expectancy - US.svg 1,000 × 750; 9 KB
-
 Comparison gender life expectancy CIA factbook.svg 512 × 448; 127 KB
-
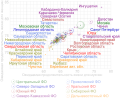 Comparison of life expectancy in Russian subjects by sex -ru.svg 512 × 426; 69 KB
-
 Comparison of life expectancy in Russian subjects by sex.svg 512 × 446; 56 KB
-
 Comparison of male and female life expectancy -Africa -ru.svg 512 × 407; 36 KB
-
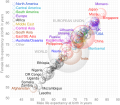
 Comparison of male and female life expectancy -Africa.svg 512 × 407; 33 KB
-
 Comparison of male and female life expectancy -America -ru.svg 512 × 407; 24 KB
-
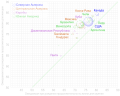
 Comparison of male and female life expectancy -America.svg 512 × 407; 23 KB
-
 Comparison of male and female life expectancy -Asia -ru.svg 512 × 407; 39 KB
-
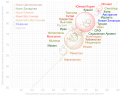
 Comparison of male and female life expectancy -Asia.svg 512 × 407; 36 KB
-
 Comparison of male and female life expectancy -Europe -ru.svg 512 × 407; 31 KB
-
 Comparison of male and female life expectancy -Europe.svg 512 × 407; 29 KB
-
 Comparison of male and female life expectancy -world -ru.svg 512 × 407; 92 KB
-
 Comparison of male and female life expectancy -world.svg 512 × 407; 85 KB
-

-
 Difference between male and female life expectancy, OWID.svg 850 × 600; 8 KB
-

-
 Healthy life expectancy bar chart -Africa -sex -ru.png 1,724 × 588; 81 KB
-
 Healthy life expectancy bar chart -Africa -sex.png 1,724 × 587; 73 KB
-
 Healthy life expectancy bar chart -America -sex -ru.png 1,333 × 592; 73 KB
-
 Healthy life expectancy bar chart -America -sex.png 1,333 × 576; 62 KB
-
 Healthy life expectancy bar chart -Asia -sex -ru.png 1,724 × 604; 84 KB
-
 Healthy life expectancy bar chart -Asia -sex.png 1,724 × 593; 74 KB
-
 Healthy life expectancy bar chart -Asia and Oceania -sex -ru.png 1,724 × 604; 88 KB
-
 Healthy life expectancy bar chart -Asia and Oceania -sex.png 1,724 × 593; 77 KB
-
 Healthy life expectancy bar chart -CIS -sex -ru.png 887 × 620; 49 KB
-
 Healthy life expectancy bar chart -CIS -sex.png 747 × 593; 39 KB
-
 Healthy life expectancy bar chart -Europe -sex -ru.png 1,724 × 593; 80 KB
-
 Healthy life expectancy bar chart -Europe -sex.png 1,724 × 586; 73 KB
-
 Healthy life expectancy bar chart -European Union -sex -ru.png 1,249 × 592; 62 KB
-
 Healthy life expectancy bar chart -European Union -sex.png 1,249 × 585; 55 KB
-
 Healthy life expectancy bar chart -Latin America -sex -ru.png 943 × 608; 59 KB
-
 Healthy life expectancy bar chart -Latin America -sex.png 943 × 576; 49 KB
-
 Healthy life expectancy bar chart -WHO regions -sex -ru.png 887 × 627; 47 KB
-
 Healthy life expectancy bar chart -WHO regions -sex.png 887 × 601; 36 KB
-
 Healthy life expectancy bar chart -world -sex -ru.png 1,724 × 584; 81 KB
-
 Healthy life expectancy bar chart -world -sex.png 1,724 × 587; 71 KB
-
 Life expectancy in Russia (by Rosstat) -v3 -diff -ru.png 1,081 × 1,081; 241 KB
-
 Life expectancy in Russia (by Rosstat) -v3 -diff.png 1,081 × 1,081; 231 KB
-
 Life expectancy in USA by race -sex gap -ru.png 1,153 × 1,153; 155 KB
-
 Life expectancy in USA by race -sex gap.png 1,081 × 1,081; 131 KB
-
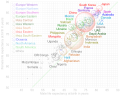
 Life expectancy of women vs life expectancy of men, OWID.svg 850 × 600; 39 KB
-
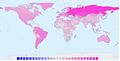 LifeExpectancyBetweenFemaleAndMales.jpg 1,027 × 519; 83 KB


_-v3_-diff_-ru.png)
_-v3_-diff.png)


