Category:Sociological bar charts
Media in category "Sociological bar charts"
The following 95 files are in this category, out of 95 total.
-

-
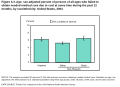 %NoCareCost.svg 685 × 493; 13 KB
-
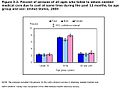 %NoHealthCareAge.JPG 655 × 480; 39 KB
-
 %NoInsurance.JPG 675 × 413; 35 KB
-
 %NoInsurance.svg 675 × 413; 28 KB
-
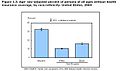 %NoInsuranceRace.JPG 690 × 411; 30 KB
-
 %NoInsuranceRace.svg 690 × 411; 10 KB
-
 Anmäld misshandel 1975-2006.svg 1,053 × 744; 330 KB
-
 Average earnings of workers by education and sex - 2006.png 963 × 721; 57 KB
-
 Bar of cars motorcycles population.png 895 × 463; 26 KB
-
 Chart of non-greek population of Vrilissia.jpg 642 × 263; 46 KB
-
 Child labour distribution chart.png 940 × 470; 24 KB
-
 Childmortality-region.jpg 615 × 404; 35 KB
-
 Contraceptiveuseandchildbearing-region.jpg 478 × 372; 32 KB
-
 Dchomicidechart.svg 554 × 740; 143 KB
-
 Distribution of U.S. Federal Taxes 2000.JPG 539 × 330; 33 KB
-
 Divorce Age Women Sweden.png 686 × 527; 46 KB
-
 Divorce Ages of Men Sweden 2010.png 673 × 534; 80 KB
-
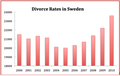 Divorce Rates Sweden.png 749 × 476; 70 KB
-
 Educational Ranking by Religious Group - 2001-ar.png 1,023 × 598; 111 KB
-
 Educational Ranking by Religious Group - 2001.png 1,139 × 665; 47 KB
-
 Employed civilians by occupation and sex - 2007.png 928 × 686; 47 KB
-
 Employed civilians by occupation and sex 2013.jpg 1,620 × 942; 75 KB
-
 Exercício 19 da Iniciação à Pesquisa Científica.png 920 × 462; 15 KB
-
 Exercício do ploter teste.jpg 929 × 422; 61 KB
-

-
 Figures1.gif 560 × 434; 18 KB
-
 Government expenditures on police judicial and corrections 1982-2010.png 1,284 × 740; 86 KB
-
 Grafhoritzontal01.jpg 550 × 298; 34 KB
-
 HealthAssess.jpeg 695 × 525; 49 KB
-
 Hofstede-Cultural-Dimensions-Swedish-Huge.png 1,200 × 730; 14 KB
-
 Homicide and Suicide Rate by Country.svg 2,000 × 800; 82 KB
-
 Homicide rate2004-ar.png 800 × 439; 31 KB
-
 Homicide rate2004.svg 1,220 × 669; 18 KB
-
 Homicide suicide USA.gif 501 × 272; 8 KB
-
 Honeypot score by sector and main field of science.svg 842 × 595; 136 KB
-
 Income Ranking by Religious Group - 2000-ar.png 797 × 593; 116 KB
-
 Income Ranking by Religious Group - 2000.png 915 × 678; 67 KB
-
 Infantmortality-region.jpg 603 × 461; 40 KB
-
 Infantmortalityandchildbearing-region.jpg 506 × 377; 32 KB
-
 International homicide rates 2002.jpg 981 × 741; 179 KB
-
 Intlhomrate-zh-hant.svg 639 × 475; 322 KB
-
 Intlhomrate.svg 639 × 475; 437 KB
-
 Juvenile detention rate in Australia (per 100,000 people).png 1,460 × 787; 17 KB
-
 Leseminuten DE 2002.svg 680 × 480; 19 KB
-
 Lifeexpectancy-region.jpg 605 × 448; 42 KB
-
 Lowestbirthrates.jpg 615 × 449; 49 KB
-
 Mean annual income by sex and education 2012.jpg 1,588 × 963; 81 KB
-
 Medicare's Future - 2014-2088.png 1,009 × 693; 46 KB
-
 Men average age of divorce sweden.png 498 × 458; 58 KB
-
 Nationalism-in-int-comparison-Swedish-Huge.png 1,200 × 754; 27 KB
-
 Net worth by race ethnicity - 2002.png 921 × 669; 45 KB
-
 Net Worth by Race-Ethnicity 2012.png 1,002 × 825; 26 KB
-
 NoCareCost.jpg 685 × 493; 43 KB
-
 ObesitySexRace.jpg 684 × 494; 47 KB
-
 Operating Incomes of Aetna Kaiser Permanente and Humana from 2011-2013.png 1,176 × 840; 36 KB
-
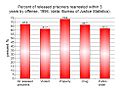
 Percent of total crime reported 1992-2003.jpg 981 × 741; 258 KB
-
 Percentage not Covered by Health Insurance by Income - 2008 to 2012.png 1,225 × 914; 26 KB
-

-
 Percentage of Population Residing in Urban Areas 1950-2050.png 1,658 × 707; 114 KB
-
 Percentofmanagersbyraceethnicity2002.png 845 × 481; 22 KB
-
 Poorestquintilebysurvivingondollar.jpg 738 × 481; 60 KB
-
 Population growth in more and less developed regions 1950-2100.png 1,669 × 770; 60 KB
-
 Population of Calumet City 1900-2010.JPG 1,457 × 897; 108 KB
-
 PrevalenceOverweightAge6-19.GIF 720 × 540; 12 KB
-

-
 Race-ethnicity and mortgages.png 945 × 702; 42 KB
-
 Graph for wiki.PNG 470 × 299; 9 KB
-
 Graph of psych study.PNG 490 × 297; 8 KB
-
 Graph of study.PNG 489 × 298; 8 KB
-
 Rape rate per 100,000 - country comparison - United Nations 2012.png 1,099 × 650; 44 KB
-
 Rape rates for select countries -2012.png 1,729 × 824; 66 KB
-
 Rast svjetskog stanovnistva.jpg 605 × 408; 84 KB
-
 Rates of various crimes on US higher education campuses.png 1,427 × 820; 43 KB
-
 Ratio of Women's Earnings to Men's by Age 2012.png 1,617 × 1,021; 33 KB
-
 Recidivism 1994.jpg 981 × 741; 309 KB
-
 Recidivism rate by crime - 2005-2010.png 1,092 × 712; 27 KB
-
 Reconsideration Period.png 467 × 394; 41 KB
-
 Self-Reported Health by Education in 2012.png 1,173 × 805; 46 KB
-
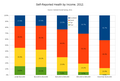 Self-Reported Health by Income in 2012.png 1,184 × 801; 45 KB
-
 Self-Reported Health by Race-Ethnicity in 2012.png 1,112 × 773; 35 KB
-
 Social Security's Future - 2014-2088.png 1,140 × 650; 47 KB
-
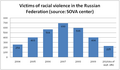 Statracisminrussia.png 582 × 341; 15 KB
-
 Sveriges största invandrargrupper.png 1,023 × 490; 20 KB
-
 Total Fertility Rates for Select Countries-2005-2010.jpg 1,399 × 925; 62 KB
-
 Trendsinchildbearing-region.png 517 × 394; 91 KB
-
 Ttm1.jpg 809 × 573; 102 KB
-
 United States median income by education and sex full time 25-64.svg 1,200 × 750; 5 KB
-
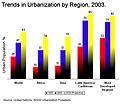 Urbanization-region.jpg 554 × 480; 43 KB
-
 Us births by mother's living situation.png 933 × 598; 30 KB
-
-
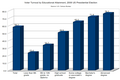
 Voter Turnout by Income, 2008 US Presidential Election.png 881 × 622; 38 KB
-
 Voter Turnout by Race-Ethnicity, 2008 US Presidential Election.png 973 × 673; 24 KB
-
 Voter Turnout by Sex and Age, 2008 US Presidential Election.png 911 × 588; 35 KB
-
 Worldpopulationgrowth-billions.jpg 605 × 408; 38 KB
,_Pew_Research.png)


.jpg)


.png)


