Category:Specific energy - depth diagrams (open channel flow)
Media in category "Specific energy - depth diagrams (open channel flow)"
The following 49 files are in this category, out of 49 total.
-
 Alternatedepth parabolic.png 813 × 518; 45 KB
-
 Canal con profundidad 3.jpg 626 × 449; 21 KB
-
 ConjugateDepths.png 813 × 517; 51 KB
-
 Curva de energia especifica.jpg 624 × 401; 25 KB
-
 Datos.png 792 × 612; 7 KB
-
 Depth discharge graph in a triangular channel.png 362 × 394; 17 KB
-
 Dimensionless1.jpg 540 × 371; 35 KB
-
 DimensionlessE'-y'diagram.jpg 541 × 372; 39 KB
-
 E-h diagram of constriction and downwards step.png 648 × 418; 22 KB
-
 E-y Curve.jpg 746 × 485; 56 KB
-
 E-y diagram of constriction and downwards step with a choke.png 801 × 472; 21 KB
-
 E-y diagram of constriction and downwards step with minimum step.png 842 × 497; 18 KB
-
 E-y diagram of constriction and downwards step without a choke.png 588 × 352; 13 KB
-
 E-y diagram of constriction and downwards step.png 648 × 418; 14 KB
-
 E-y Diagram.jpg 340 × 268; 12 KB
-
 E-y diagram.png 819 × 495; 28 KB
-
 E-y Step choke.png 832 × 526; 18 KB
-
 Energía Específica 3D.png 892 × 640; 49 KB
-
 ENERGÍA ESPECÍFICA.jpg 1,024 × 656; 177 KB
-
 Ey diagram triangular channel.png 485 × 409; 25 KB
-
 Ey diagram.png 813 × 517; 48 KB
-
 EYDiagram-AltDepths.png 771 × 459; 31 KB
-
 EYDiagram-General.png 754 × 454; 34 KB
-
 EYDiagram-IncrDischarges.png 754 × 454; 37 KB
-
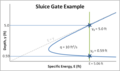 EYDiagram-SluiceGateEx.png 771 × 459; 31 KB
-
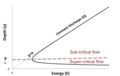
 EYDiagram-SSCritical.png 754 × 454; 27 KB
-
 Eynw.png 403 × 387; 10 KB
-
 Figure 3 Different M y Curves.png 892 × 567; 138 KB
-
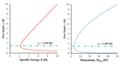 Figure 4 E y vs M y.png 916 × 487; 77 KB
-
 Figure 5 M y Curve. Subcritical and Supercritical Regions.png 842 × 649; 59 KB
-
 Figure 6 M y Diagram. Showing Conjugate Depths.png 814 × 561; 53 KB
-
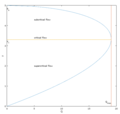
 Flowregimes parabolic.png 813 × 517; 58 KB
-
 FlowRegimes.png 813 × 518; 45 KB
-
 Geometrytri.png 378 × 353; 10 KB
-
 Grafico del carico specifico delle correnti dei fiumi.jpg 952 × 831; 136 KB
-
 M-y Diagram.jpg 365 × 300; 20 KB
-
 M-y Diagram.png 416 × 386; 9 KB
-
 M-y Diagram2.png 476 × 351; 13 KB
-
 Q-y Diagram.png 552 × 525; 19 KB
-
 Qycurve.png 534 × 769; 59 KB
-
 Specif energie.png 3,448 × 3,203; 133 KB
-
 Specific Energy diagram choke condition.jpg 540 × 368; 38 KB
-
 Specific Energy Diagram.jpg 640 × 400; 37 KB
-
 Specific energy-Water depth.png 557 × 545; 22 KB
-
 Specific Energy.jpg 640 × 400; 35 KB
-
 Specific energy.svg 1,260 × 748; 64 KB
-
 비에너지와 한계수심.png 711 × 661; 32 KB
-
 비에너지와 한계수심1.png 695 × 695; 25 KB
-
 상류 수중보2.png 759 × 631; 27 KB


