Category:Statistics about minerals in Western Australia
Media in category "Statistics about minerals in Western Australia"
The following 33 files are in this category, out of 33 total.
-

-

-

-

-

-

-
-
-

-

-

-

-

-
-

-

-

-
-

-

-
 Mayor West Australian Commodities in 2020.png 3,361 × 2,198; 371 KB
-
 Mayor West Australian Commodities in 2021.png 3,361 × 2,198; 399 KB
-
 Mayor West Australian Commodities in 2022.png 2,863 × 1,648; 159 KB
-
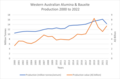 Western Australian Alumina & Bauxite production from 2000 to 2022.png 2,015 × 1,323; 95 KB
-
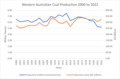 Western Australian Coal Production chart 2000 to 2022.png 2,015 × 1,323; 100 KB
-
 Western Australian Copper Production chart 2000 to 2020.png 2,016 × 1,334; 60 KB
-
 Western Australian Gold Production chart 1999 to 2021.png 3,352 × 2,188; 76 KB
-
 Western Australian Gold Production chart 2000 to 2022.png 2,015 × 1,323; 55 KB
-
 Western Australian Iron Ore Production chart 2000 to 2021.png 3,361 × 2,198; 88 KB
-
 Western Australian Iron Ore Production chart 2000 to 2022.png 2,015 × 1,323; 61 KB
-
 Western Australian Lithium Production chart 2012 to 2022.png 2,108 × 1,337; 48 KB
-
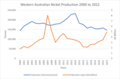 Western Australian Nickel Production chart 2000 to 2022.png 2,015 × 1,323; 62 KB
-
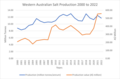 Western Australian Salt Production chart 2000 to 2022.png 2,015 × 1,323; 61 KB


