Category:Stock analysis
Subcategories
This category has the following 3 subcategories, out of 3 total.
P
- Price-to-earnings ratio (6 F)
T
Media in category "Stock analysis"
The following 12 files are in this category, out of 12 total.
-
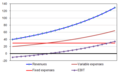
 Chepakovich model-chart1.JPG 729 × 512; 40 KB
-
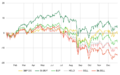 Chepakovich valuation model 2015 performance chart.png 800 × 500; 101 KB
-
 Chepakovich Valuation Model.png 562 × 346; 11 KB
-
 Computation of Public Float.jpg 1,218 × 179; 53 KB
-
 Dividend stocks.jpg 1,157 × 1,624; 628 KB
-
 Du Pont-modellen.jpg 1,081 × 646; 174 KB
-
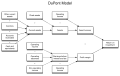 DuPontModelEng.svg 955 × 598; 15 KB
-
 Fundamentalanalyse.JPG 1,079 × 575; 133 KB
-
 FundamentalLKOHSIBN.jpg 597 × 885; 84 KB
-
 Informatics General Corporation quarterly reports and analysts briefing.jpg 2,747 × 3,373; 1.8 MB
-
 ModeloGordon.jpg 221 × 78; 3 KB
-
 Value-investing.jpg 572 × 262; 41 KB


