Category:Temporal population graphs of Japan
Media in category "Temporal population graphs of Japan"
The following 28 files are in this category, out of 28 total.
-
 Gráfica de población de Japón.png 800 × 560; 61 KB
-
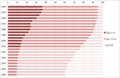
 Changes in population Tohoku Japan.png 814 × 681; 126 KB
-
 Japan Age Makeup 1920-2010 with Projection to 2060 (Ukranian).png 1,527 × 998; 35 KB
-
 Japan Age Makeup 1920-2010 with Projection to 2060.png 1,527 × 998; 45 KB
-
 Japan Population by Age 1920-2010 with Projection to 2060.png 1,527 × 998; 61 KB
-
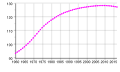 Japan population.svg 750 × 450; 10 KB
-
 Japan-demography.png 725 × 426; 20 KB
-
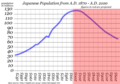 Japanese population chart 1870-2100.png 800 × 560; 55 KB
-
 JapanPopulation1872-2050.jpg 1,800 × 1,200; 355 KB
-
 Population in East Asia, 1870-1950.svg 953 × 669; 75 KB
-
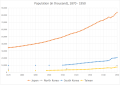
 Population in East Asia, 1870-2018.svg 953 × 669; 87 KB
-
 Population in East Asia, 1945-2018.svg 953 × 669; 91 KB
-
 Population Japon 1900-2000 graphe.png 1,102 × 618; 23 KB
-
 Population of Japan since 1872.svg 512 × 256; 42 KB
-
 Population of Japan.svg 1,500 × 800; 9 KB
-
 População japonesa gráfico.png 800 × 560; 60 KB
-
 The populartion of Sugaogaoka.svg 512 × 337; 24 KB
-
 The populartion of Inukura.svg 512 × 330; 74 KB
-
 The population of Hatsuyama, Kawasaki.svg 512 × 333; 54 KB
-
 The population of Keyakidaira, Kawasaki.svg 512 × 315; 31 KB
-
 The population of Mizusawa, Kawasaki.svg 512 × 291; 69 KB
-
 The population of Nampeidai, Kawasaki.svg 512 × 342; 38 KB
-
 The population of Shiboku-honcho, Kawasaki.svg 512 × 340; 34 KB
-
 The population of Shiomidai, Kawasaki.svg 512 × 355; 37 KB
-
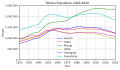 Tohoku Population 1920-2020.svg 612 × 352; 49 KB
-
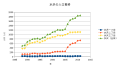
 多摩ニュータウンの人口推移(S50-H22).png 600 × 360; 21 KB
-
 多摩ニュータウンの年齢別人口構成+日本(住民基本台帳平成25年4月1日現在).png 601 × 361; 37 KB
-
 日本1872-2105年人口走勢圖.svg 578 × 308; 59 KB


.png)


