Category:Valid SVG created with R
Subcategories
This category has only the following subcategory.
Media in category "Valid SVG created with R"
The following 183 files are in this category, out of 183 total.
-
 100 prisoners problem.svg 600 × 570; 70 KB
-
 2019-nCoV Cases.svg 512 × 410; 41 KB
-
 2019-nCoV in China.svg 512 × 410; 63 KB
-
 2019-nCoV in Wuhan.svg 512 × 410; 48 KB
-
 Acf.svg 217 × 289; 50 KB
-
 Al-Cu-spotprice.svg 720 × 540; 93 KB
-
 Al-spotprice1987-2012.svg 578 × 434; 11 KB
-
 Analemma.svg 900 × 990; 158 KB
-
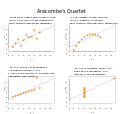 Anscombe with text.svg 1,000 × 950; 167 KB
-
 Anscombe's quartet 2.svg 990 × 752; 162 KB
-
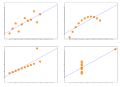 Anscombe's quartet.svg 990 × 720; 39 KB
-
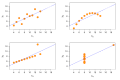 Anscombe.svg 945 × 630; 57 KB
-
 Antu application-x-object.svg 512 × 512; 1 KB
-
 Article Feedback Count Data.svg 900 × 564; 78 KB
-
 Australia-temp-anomaly-1910-2009.svg 720 × 540; 185 KB
-
 Balliol CollegeNorrington Ranking.svg 360 × 360; 57 KB
-
 Barchart linechart 01.svg 1,500 × 500; 10 KB
-
 Baringhead co2 v9.svg 720 × 540; 388 KB
-
 Bernoulli Distribution de.svg 749 × 468; 32 KB
-
 Beta-distribution.svg 563 × 375; 29 KB
-
 BetaBinomVsBinom.svg 593 × 533; 56 KB
-
 BinomialTest.svg 630 × 630; 35 KB
-
 Black cherry tree histogram no title.svg 216 × 216; 3 KB
-
 Bostonh hetres Heroskedastische Residuen.svg 450 × 450; 122 KB
-
 Bostonh hetres Lineare Regression.svg 450 × 450; 122 KB
-
 Bostonh hetres.svg 900 × 450; 347 KB
-
 Brasenose CollegeNorrington Ranking.svg 360 × 360; 58 KB
-
 C control chart.svg 630 × 629; 39 KB
-
 Canterbury Regional Council Consent Applications Backlog.svg 614 × 477; 143 KB
-
 Capacidad por fuente Colombia 2005.svg 720 × 720; 17 KB
-
 Car stopping distances-1920.svg 723 × 578; 12 KB
-
 Cers-pie-Oct-2012.svg 578 × 578; 7 KB
-
 Christ ChurchNorrington Ranking.svg 360 × 360; 58 KB
-
 CLTBinomConvergence.svg 1,012 × 650; 33 KB
-
 Corpus Christi CollegeNorrington Ranking.svg 360 × 360; 60 KB
-
 Cristallisation-chocolat.svg 540 × 540; 46 KB
-
 Czechia believers 2021 census.svg 2,109 × 596; 85 KB
-
 DelaportePMF.svg 515 × 421; 53 KB
-
 Ee real gdp growth.svg 1,350 × 900; 44 KB
-
 ErlangDichteF.svg 723 × 578; 12 KB
-
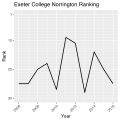 Exeter CollegeNorrington Ranking.svg 360 × 360; 56 KB
-
 ExpDichteF.svg 506 × 506; 9 KB
-
 ExpVerteilungF.svg 506 × 506; 9 KB
-
 Fi real gdp growth.svg 1,350 × 900; 42 KB
-
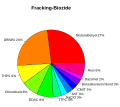 Fracbiozide.svg 672 × 600; 54 KB
-

-
 Genome size vs number of genes.svg 1,350 × 900; 1.74 MB
-
 Genome size vs protein count.svg 512 × 512; 11.02 MB
-
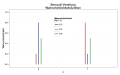
 GermanyUnemploymentRate.svg 990 × 630; 60 KB
-
 Graph comparing article edits on Wikivoyage and Wikitravel.svg 585 × 405; 80 KB
-
 GumbelDichteF.svg 723 × 578; 16 KB
-
 Halton sequence 2D.svg 289 × 289; 37 KB
-
 Harnstoffpreis.svg 720 × 540; 76 KB
-
 Harris Manchester CollegeNorrington Ranking.svg 360 × 360; 60 KB
-
 Haukilahti population.svg 720 × 435; 56 KB
-
-
 Hertford CollegeNorrington Ranking.svg 360 × 360; 58 KB
-
 Hexenanklagen Herzogtum Westfalen 1508–1732 logscale.svg 1,260 × 630; 83 KB
-
 Hexenanklagen Herzogtum Westfalen 1508–1732.svg 1,260 × 630; 79 KB
-
 Histogram example.svg 361 × 289; 6 KB
-
 Histogram of arrivals per minute.svg 614 × 520; 175 KB
-
 Histogram4.svg 630 × 630; 75 KB
-
 Individuals chart for a paired individuals and MR chart.svg 630 × 629; 42 KB
-
 Ingressos pressupost CCMA 2017.svg 347 × 301; 8 KB
-
 Inhomogeneouspoissonprocess.svg 603 × 415; 38 KB
-
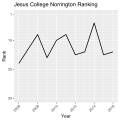 Jesus CollegeNorrington Ranking.svg 360 × 360; 58 KB
-
 Kakapo-population-size.svg 487 × 374; 77 KB
-
 Kapuni-m3.svg 578 × 434; 6 KB
-
 Keble CollegeNorrington Ranking.svg 360 × 360; 57 KB
-
 Kernel density.svg 250 × 200; 42 KB
-
 Kyoto-Related Fossil-Fuel Carbon Dioxide Emissions 1990-2007.svg 578 × 434; 13 KB
-
 Lady Margaret HallNorrington Ranking.svg 360 × 360; 58 KB
-
 Lawdome75yrco2.svg 506 × 434; 32 KB
-
 Lincoln CollegeNorrington Ranking.svg 360 × 360; 57 KB
-
 LogBase10.svg 145 × 145; 8 KB
-
 Logit-probit.svg 630 × 630; 37 KB
-
 Magdalen CollegeNorrington Ranking.svg 360 × 360; 57 KB
-
 Mansfield CollegeNorrington Ranking.svg 360 × 360; 59 KB
-
 Mauna Loa CO2 monthly mean concentration DE.svg 708 × 708; 438 KB
-
 Mauna Loa CO2 monthly mean concentration FR.svg 708 × 708; 439 KB
-
 Mauna Loa CO2 monthly mean concentration NL.svg 708 × 708; 436 KB
-
 Mauna Loa CO2 monthly mean concentration NO.svg 708 × 708; 441 KB
-
 Mauna Loa CO2 monthly mean concentration PL.svg 708 × 708; 442 KB
-
 Mauna Loa CO2 monthly mean concentration RO.svg 708 × 708; 438 KB
-
 Mauna Loa CO2 monthly mean concentration RU.svg 708 × 708; 451 KB
-
 Mauna Loa CO2 monthly mean concentration-ca.svg 708 × 708; 438 KB
-
 Mauna Loa CO2 monthly mean concentration-es.svg 708 × 708; 434 KB
-
 Mauna Loa CO2 monthly mean concentration.svg 708 × 708; 434 KB
-
 Mauna Loa CO2 monthly mean concentrationCS.svg 708 × 708; 447 KB
-
 Merton CollegeNorrington Ranking.svg 360 × 360; 56 KB
-
 Michelsonmorley-boxplot.svg 432 × 432; 11 KB
-
 Mobile Uploads – Lupo's logs.SVG 1,260 × 630; 63 KB
-
 MR chart for a paired individuals and MR chart.svg 630 × 629; 38 KB
-
 Multilateral environmental treaties-by-decennium-subject-de.svg 484 × 375; 96 KB
-
 Multilateral environmental treaties-by-decennium-subject-en.svg 484 × 375; 87 KB
-
 Multilateral environmental treaties-by-year-and-type-en.svg 484 × 375; 84 KB
-
 Multilateral environmental treaties-by-year-and-type.svg 484 × 375; 87 KB
-
 New CollegeNorrington Ranking.svg 360 × 360; 56 KB
-
 New Zealand Greenhouse Gas Emissions 1990 to 2017.svg 720 × 540; 149 KB
-
 New Zealand Observed Electricity Consumption Sector.svg 552 × 401; 9 KB
-
 New Zealand overseas debt 1993-2010.svg 720 × 540; 91 KB
-
 Niittykumpu population.svg 720 × 435; 54 KB
-
 Northern Hemisphere Azimuthal projections.svg 677 × 689; 1.19 MB
-
 Np control chart.svg 630 × 629; 38 KB
-
 NZ Electricity Generation.svg 552 × 402; 16 KB
-
 NZ Energy 2008.svg 564 × 477; 5 KB
-
 NZ greenhouse gases by sector.svg 720 × 540; 143 KB
-
 NZ Gross GhG Emissions 1861 to 2012.svg 720 × 540; 74 KB
-
 NZ-best-land-temp-anom.svg 720 × 540; 137 KB
-
 NZ-ghg-2010-720by540.svg 720 × 540; 128 KB
-
 NZ-ghg-2012-720by540.svg 720 × 540; 84 KB
-
 Nzgasfield.svg 578 × 434; 5 KB
-
 Ogive.svg 630 × 630; 76 KB
-

-
 Oriel CollegeNorrington Ranking.svg 360 × 360; 56 KB
-
 P control chart.svg 630 × 629; 38 KB
-
 Pareto chart of titanium investment casting defects.svg 614 × 623; 25 KB
-
 Pembroke CollegeNorrington Ranking.svg 360 × 360; 58 KB
-
 Percentage of Order of Australia honours to women.svg 750 × 525; 86 KB
-
 Piechart.svg 703 × 321; 13 KB
-
 Piecharts.svg 689 × 494; 39 KB
-
 Polacy w Hadze.svg 720 × 540; 58 KB
-
 Population of Estonia.svg 540 × 450; 25 KB
-
 PromotorsK01589 logo 1.svg 1,200 × 1,200; 49 KB
-
 Quantile graph.svg 1,355 × 903; 705 KB
-
 R chart for a paired xbar and R chart.svg 630 × 629; 34 KB
-
 R-cars log lowess example.svg 360 × 360; 67 KB
-
 R-horsekick totals-density.svg 360 × 225; 74 KB
-
 R-US state areas-basicboxplot.svg 450 × 135; 64 KB
-
 R-US state areas-density.svg 360 × 225; 70 KB
-
 R-US state areas-hist+dens sqrt.svg 450 × 270; 81 KB
-
 Rating count density by project quality assessment.svg 796 × 564; 167 KB
-
 Reg ls curvilínia.svg 630 × 630; 46 KB
-
 Reg ls qq edat pad.svg 630 × 630; 69 KB
-
 Reg ls sin2.svg 630 × 630; 42 KB
-
 S chart for a paired xbar and s chart.svg 630 × 629; 35 KB
-
 Scaled chi squared cdf.svg 270 × 270; 52 KB
-
 Scaled chi squared.svg 270 × 270; 54 KB
-
 Scaled inverse chi squared cdf.svg 270 × 270; 49 KB
-
 Sealevel-rise 1870-2009 de.svg 610 × 518; 113 KB
-
 Simple barplot.svg 723 × 578; 3 KB
-
 Somerville CollegeNorrington Ranking.svg 360 × 360; 58 KB
-
 SovCDS-rating de.svg 702 × 540; 155 KB
-
 St Anne's CollegeNorrington Ranking.svg 360 × 360; 59 KB
-
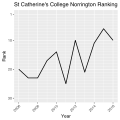 St Catherine's CollegeNorrington Ranking.svg 360 × 360; 60 KB
-
 St Edmund HallNorrington Ranking.svg 360 × 360; 58 KB
-
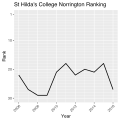 St Hilda's CollegeNorrington Ranking.svg 360 × 360; 60 KB
-
 St Hugh's CollegeNorrington Ranking.svg 360 × 360; 60 KB
-
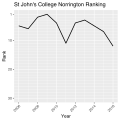 St John's CollegeNorrington Ranking.svg 360 × 360; 60 KB
-
 St Peter's CollegeNorrington Ranking.svg 360 × 360; 59 KB
-
 Standard deviation diagram.svg 400 × 200; 17 KB
-
 Streckgrenze PV Wochentage.svg 698 × 473; 40 KB
-
 Taxa de perill malalts amb sida.svg 630 × 630; 59 KB
-
 Temp anomalies 2000yrs pages2k-de.svg 1,065 × 425; 4.81 MB
-
 Temp anomalies 2000yrs pages2k-en.svg 1,065 × 425; 4.8 MB
-
 The Queen's CollegeNorrington Ranking.svg 360 × 360; 60 KB
-
 Tiefkühlkonsum.svg 760 × 580; 9 KB
-
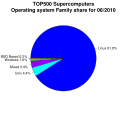 TOP500 operating system family share.svg 630 × 630; 61 KB
-
 Trinity CollegeNorrington Ranking.svg 360 × 360; 57 KB
-
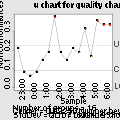 U control chart.svg 630 × 629; 39 KB
-
 UK Debt as percentage of GDP.svg 643 × 335; 93 KB
-
-
 University CollegeNorrington Ranking.svg 360 × 360; 59 KB
-
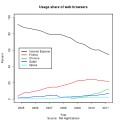 Usage share of web browsers (Source Net Applications).svg 630 × 630; 52 KB
-
 Usage share of web browsers (Source StatCounter).svg 1,260 × 630; 79 KB
-
 Vendanges france 1892-2014 en US.svg 1,041 × 644; 325 KB
-
 Wadham CollegeNorrington Ranking.svg 360 × 360; 59 KB
-
 Web browser usage share.svg 630 × 630; 47 KB
-
 Winter-NAO-Index-DE.svg 566 × 351; 158 KB
-
 Winter-NAO-Index-FR.svg 566 × 351; 159 KB
-
 Winter-NAO-Index-IT.svg 566 × 351; 153 KB
-
 Winter-NAO-Index.svg 566 × 351; 154 KB
-
 Wollepreis AWEX.svg 720 × 540; 89 KB
-
 Worcester CollegeNorrington Ranking.svg 360 × 360; 58 KB
-
 Xbar chart for a paired xbar and R chart.svg 630 × 629; 37 KB
-
 Xbar chart for a paired xbar and s chart.svg 630 × 629; 43 KB
-
 YouTube Rewind 2018 and Baby dislikes.svg 672 × 672; 8 KB
-
 Zuckerpreis 1991.svg 720 × 540; 68 KB
-
 Évolution des dates de vendanges en France (1892-2014).svg 1,041 × 644; 334 KB
-
 Česko vyznání, sčítání 2021.svg 2,109 × 596; 95 KB
-
 中国境内新型冠状病毒感染的肺炎疫情报告.svg 512 × 410; 1.38 MB
-
 中国湖北武汉新型冠状病毒感染的肺炎疫情报告.svg 512 × 410; 1.76 MB
-
 全球新型冠状病毒感染的肺炎疫情报告.svg 512 × 410; 1,010 KB


.svg)


.svg)

.svg)
.svg)


.svg)


