Category:Vertical 3D bar charts
Media in category "Vertical 3D bar charts"
The following 200 files are in this category, out of 205 total.
(previous page) (next page)-
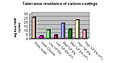 10.electroless.nickel.jpg 755 × 394; 37 KB
-
 1985~2001年の名阪特急輸送人員図.jpg 5,454 × 3,273; 1.03 MB
-
 2011 Fiscal year Foreign Food Inspection chart by FDA.png 981 × 628; 42 KB
-
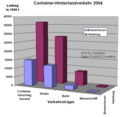 2013 11 16 Container Hinterland Verkehr.png 667 × 651; 31 KB
-
 2013 Hamburg Hafenumschlag 2000 2012 2025.png 848 × 829; 50 KB
-
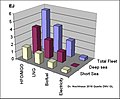 2018 10 16 Bild Energieverbrauch Schifffahrt 2050.jpg 1,031 × 850; 70 KB
-
 2018mainss.jpg 906 × 439; 137 KB
-
 22c196 Figure5.jpg 713 × 395; 29 KB
-
 22c196 Figure7.jpg 713 × 428; 36 KB
-
 22c196 Figure8.jpg 713 × 428; 35 KB
-
 3D Bar Graph Meeting.jpg 500 × 500; 94 KB
-
 3D.chart.-.swiss.weapon,.ammunition.and.detonator.exports.in.WW2.1940-1944.jpg 1,058 × 852; 114 KB
-
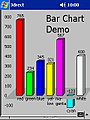 3DBarchart.jpg 240 × 320; 24 KB
-
 3dsyoutyuukou-age.PNG 375 × 561; 13 KB
-
 5and6legiseatcompar.png 513 × 407; 18 KB
-
 Abschieds-Alter-Perioden.PNG 851 × 623; 24 KB
-
 Aglomerace.PNG 675 × 316; 12 KB
-
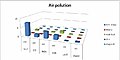 Air polution graph.JPG 705 × 355; 25 KB
-
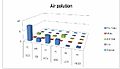 Air polution graph1.JPG 631 × 363; 22 KB
-
 Airbus vs Boeing.JPG 623 × 512; 41 KB
-
 Alter beim letzten Tor in der Nationalmannschaft.png 1,121 × 554; 36 KB
-
 Antalannonser2009.png 385 × 238; 21 KB
-
 Aquariumwerte.png 896 × 717; 17 KB
-
 Arroyo Grande - pyramide des âges.jpg 970 × 603; 44 KB
-
 B2.EIO-LCA Summary.jpg 797 × 504; 47 KB
-
 BankComparison.jpg 997 × 374; 60 KB
-
 BankEvolution.jpg 694 × 356; 52 KB
-
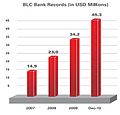 BankRecords.jpg 340 × 325; 24 KB
-
 BankRecs2.jpg 274 × 302; 19 KB
-
 Bar chart and magnifying glass.jpg 124 × 82; 3 KB
-
 Bar graph - economic statistics.jpg 1,084 × 459; 35 KB
-
 Beaufschlagungsdauer bis zum erreichen des grenzwertes grafik.png 1,546 × 846; 65 KB
-
 Bestallningar2009.png 385 × 246; 22 KB
-
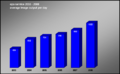
 BG epa service 2003-2008 average image output per day.png 977 × 600; 22 KB
-
 BG epa service 2003-2009 average image output per day.png 977 × 600; 24 KB
-
 BG epa service 2003-2010 average image output per day.png 977 × 600; 26 KB
-
 Bio fuel efficiency.jpg 500 × 256; 14 KB
-
 BTW05 1ho re ARD.jpg 895 × 652; 83 KB
-
 BTW05 ho re 2257 ARD.jpg 895 × 652; 138 KB
-
 BTW05 VAE CDU CSU Stapel.jpg 895 × 652; 146 KB
-
 BTW05 VAE CDU CSU.jpg 895 × 652; 138 KB
-
 Buenavista 2.jpg 419 × 267; 22 KB
-
 Calc4 - 2.png 1,024 × 768; 27 KB
-
 Cambios.png 332 × 360; 12 KB
-
 Cepfim10.JPG 690 × 433; 46 KB
-
 Cepfim11.JPG 703 × 442; 45 KB
-
 Cepfim12.JPG 683 × 439; 44 KB
-
 Cepfim13.JPG 678 × 195; 23 KB
-
 Cepfim5.JPG 705 × 420; 48 KB
-
 Cepfim6.JPG 685 × 420; 45 KB
-
 Cepfim7.JPG 685 × 428; 46 KB
-
 Cepfim8.JPG 689 × 433; 49 KB
-
 Cepfim9.JPG 696 × 434; 46 KB
-
 Cesariana comissao perinatal.png 1,177 × 679; 441 KB
-
 CH epa service 2003-2010 average image output per day.png 977 × 600; 25 KB
-
 Chart 3- time to productivity.jpg 960 × 720; 52 KB
-
 Chemiewaffenprogramm des Irak.png 610 × 550; 30 KB
-
 CHIN epa service 2003-2009 average image output per day.png 977 × 600; 23 KB
-
 CN epa service 2003-2008 average image output per day.png 977 × 600; 21 KB
-
 Der postmaterialistische Wertewandel 1970.png 835 × 499; 6 KB
-
 Dijagram1.jpg 268 × 257; 26 KB
-
 Dijagram2.jpg 533 × 328; 71 KB
-
 Distribucion de salvadoreños en el mundo.png 231 × 152; 18 KB
-
 Economic sectors and income cn.JPG 745 × 548; 59 KB
-
 Economic sectors and income.JPG 745 × 548; 43 KB
-
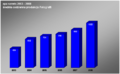
 EleccionesChile19892005.JPG 904 × 625; 75 KB
-
 EN epa service 2003-2009 average image output per day.png 977 × 600; 24 KB
-
 EN epa service 2003-2010 average image output per day.png 977 × 600; 27 KB
-
 EN epa service 2003-2011 average image output per day.png 814 × 600; 23 KB
-
 Energy table.JPG 628 × 298; 25 KB
-
 ENG epa service 2003-2010 average image output per day.png 977 × 600; 26 KB
-
 Epa service 2003-2008 average image output per day.PNG 977 × 600; 37 KB
-
 Evo colab aki.JPG 377 × 254; 12 KB
-
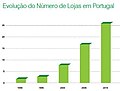 Evolucao lojas aki.JPG 368 × 278; 10 KB
-
 Evolucion-poblacion.png 878 × 289; 16 KB
-
 Expansão da cana de açucar.png 533 × 401; 87 KB
-
 Firearms export.png 537 × 433; 13 KB
-
 Foreclosure Trend.png 960 × 720; 24 KB
-
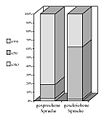
 Foreign languages Slovenia.jpg 690 × 463; 29 KB
-
 Foreign languages Éire.jpg 563 × 411; 26 KB
-
 FR epa service 2003-2009 average image output per day.png 977 × 600; 25 KB
-
 FR epa service 2003-2010 average image output per day.png 977 × 600; 26 KB
-
 Frequency of demonstratives.jpg 872 × 1,010; 210 KB
-
 Frequency of demonstratives2.jpg 872 × 1,010; 235 KB
-
 Frequency of demonstratives4.jpg 872 × 1,010; 231 KB
-
 GNE attendances.JPG 1,380 × 817; 61 KB
-
 Grafica.gif 277 × 177; 3 KB
-
 Grafik anggaran.JPG 1,217 × 672; 64 KB
-
 Grafyk behearsking Stellingwerfsk yn Weststellingwerf.PNG 720 × 382; 19 KB
-
 Graph bilan audit.JPG 832 × 443; 33 KB
-
 GraphOfHebrewWikipedia.JPG 656 × 271; 34 KB
-
 Handelsblattranking 2015.jpg 1,141 × 560; 82 KB
-
 Homweownership by race.jpg 525 × 317; 83 KB
-
 Image006enhancedcolor.gif 911 × 621; 36 KB
-

-
 Incisor cavities per thousand teeth increase with tooth age and sugar consumption.tif 2,835 × 1,970; 1.06 MB
-
 Internet pornography search terms stat.png 500 × 400; 5 KB
-
 Internet UA 2000-2013.png 1,323 × 994; 195 KB
-
 Interneti kasutajate hulk vanuseliselt protsentides.jpg 329 × 164; 11 KB
-
 IntifadaMurdered.png 430 × 271; 9 KB
-
 JP epa service 2003-2008 average image output per day.png 977 × 600; 22 KB
-
 JP epa service 2003-2009 average image output per day.png 977 × 600; 24 KB
-
 JP epa service 2003-2010 average image output per day.png 977 × 600; 25 KB
-
 KChart-screenshot2.png 802 × 635; 45 KB
-
 Ley de Schulz - Arnold o del Umbral.gif 593 × 232; 5 KB
-
 Lifetime Prevalence of Anxiety Disorders (ECA Study).jpg 618 × 475; 81 KB
-
 Ludność miasta Łodzi w latach 1985-2005.png 593 × 565; 124 KB
-
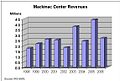 Mackinac Revenues 2.JPG 569 × 383; 34 KB
-
 Marzenia z M1.png 664 × 421; 49 KB
-
 McqStatsNov06.jpg 446 × 282; 56 KB
-
 Military Budget BIP.png 894 × 690; 33 KB
-
 Motivation profile.png 902 × 527; 39 KB
-
 MP3 compression.jpg 412 × 410; 39 KB
-
 MP3 compression.PNG 413 × 404; 39 KB
-
 Natural increase of Łódź in 1985-2005 (per 1000 population).png 594 × 565; 99 KB
-
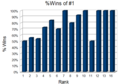 NCAA Wins Rank 1.png 600 × 420; 17 KB
-
 NCAA Wins-rank.png 600 × 420; 15 KB
-
 NL epa service 2003-2008 average image output per day.PNG 977 × 600; 23 KB
-
 NL epa service 2003-2009 average image output per day.png 977 × 600; 25 KB
-
 NL epa service 2003-2010 average image output per day.png 977 × 600; 27 KB
-
 NumAnt.png 484 × 274; 98 KB
-
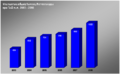
 Numbers of Soldiers in German South West Africa.jpg 1,044 × 681; 62 KB
-
 ODA 2009.png 814 × 521; 12 KB
-
 Oregon meth2008.gif 247 × 109; 2 KB
-
 Participacion de las exp en el pbi.JPG 568 × 247; 25 KB
-
 Personal pronouns2.jpg 1,257 × 1,198; 297 KB
-
 Personal pronouns3.jpg 1,257 × 1,198; 290 KB
-
 Personal pronouns4.jpg 1,257 × 1,198; 296 KB
-
 PL epa service 2003-2008 average image output per day.png 977 × 600; 23 KB
-
 PL epa service 2003-2009 average image output per day.png 977 × 600; 25 KB
-
 PL epa service 2003-2010 average image output per day.png 977 × 600; 26 KB
-
 Población por sexos.jpg 477 × 373; 40 KB
-
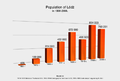 Population of Łódź in 1800-2006.png 836 × 565; 104 KB
-
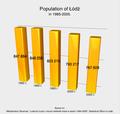 Population of Łódź in 1985-2005.png 593 × 565; 122 KB
-
 Population projection of Łódź 2010-2030.png 594 × 567; 120 KB
-

-
 Precipitations and average monthly air temperatures in Łódź in 2005.png 593 × 564; 131 KB
-
 Precipitations and average monthly air temperatures in Łódź in 2005.svg 593 × 564; 580 KB
-
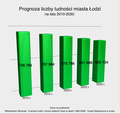 Prognoza liczby ludności miasta Łodzi na lata 2010-2030.png 594 × 566; 123 KB
-

-

-

-
 Race Income.png 400 × 301; 9 KB
-
 Radial8PartHeightLimatations.jpg 868 × 651; 56 KB
-
 Relaciones.jpg 442 × 245; 17 KB
-
 Remesas Honduras.jpg 1,030 × 738; 131 KB
-
 Repetition Rates in Primary School.png 504 × 203; 17 KB
-
 Resultado Votación sobre Coalición Pro Acceso.png 943 × 360; 53 KB
-
 Rezultati në Burrel.png 1,277 × 698; 26 KB
-
 Rezultati në Fier.png 1,277 × 698; 27 KB
-
 Rezultati në Kavajë.png 1,277 × 698; 25 KB
-
 Rezultati në Korçë.png 1,277 × 698; 28 KB
-
 Rezultati në Krujë.png 1,277 × 698; 26 KB
-
 Rezultati në Kukës.png 1,277 × 698; 25 KB
-
 Rezultati në Kuçovë.png 1,277 × 698; 24 KB
-
 Rezultati në Laç.png 1,277 × 698; 25 KB
-
 Rezultati në Lezhë.png 1,277 × 698; 24 KB
-
 Rezultati në Lushnje.png 1,277 × 698; 24 KB
-
 Rezultati në Patos.png 1,277 × 698; 24 KB
-
 Rezultati në Peshkopi.png 1,277 × 698; 27 KB
-
 Rezultati në Pogradec.png 1,277 × 698; 26 KB
-
 Rezultati në Sarandë.png 1,277 × 698; 26 KB
-
 Rezultati në Vlorë 2011.jpg 559 × 323; 27 KB
-
 Rezultati në Vlorë.png 1,277 × 698; 24 KB
-
 Rozwój demograficzny miasta Łodzi w latach 1800-2006.png 836 × 565; 109 KB
-
 RU epa service 2003-2009 average image output per day.png 977 × 600; 25 KB
-
 RU epa service 2003-2010 average image output per day.png 977 × 600; 26 KB
-
 SoderzanieQ10.jpg 864 × 346; 580 KB
-
 Sondaż 20.06.2006r. - Wykres.PNG 442 × 329; 10 KB
-
 Stemmen Beringen2012.jpg 680 × 500; 56 KB
-
 StemmenBocholt2012.jpg 680 × 500; 50 KB
-
 StemmenHam2012.jpg 680 × 500; 55 KB
-
 StemmenHamont-Achel2012.jpg 680 × 500; 54 KB
-
 StemmenHechtel-Eksel2012.jpg 680 × 500; 55 KB
-
 StemmenHouthalen-Helchteren2012.jpg 680 × 500; 61 KB
-
 StemmenLeopoldsburg2012.jpg 680 × 500; 59 KB
-
 StemmenLommel2012.jpg 680 × 500; 62 KB
-
 StemmenNeerpelt2012.jpg 680 × 500; 56 KB
-
 StemmenOvepelt2012.jpg 680 × 500; 58 KB
-
 StemmenPeer2012.jpg 680 × 500; 57 KB
-
 Studenci szkół wyższych (cywilnych) w Łodzi w latach 1975-2005.png 593 × 564; 97 KB
-
 Students of higher (civil) schools in Łódź in 1975-2005.png 593 × 564; 94 KB
-
 Switches domain.svg 735 × 527; 20 KB
-
 TH epa service 2003-2008 average image output per day.png 977 × 600; 23 KB
-
 TH epa service 2003-2009 average image output per day.png 977 × 600; 25 KB
-
 TH epa service 2003-2010 average image output per day.png 977 × 600; 26 KB
-
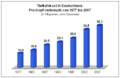 TK-Pro-Kopf-Verbrauch 1977-2007.png 571 × 370; 5 KB
-
 Transp.png 800 × 800; 14 KB
-
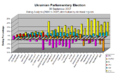
 Ukrainian parliamentary election, 2007 (ResultsByRegion).PNG 768 × 480; 15 KB
-
 Ukrainian parliamentary election, 2007 (SwingByRegion).PNG 767 × 477; 16 KB
-
 Ukrainian parliamentary election, 2007 (VoteByRegion).PNG 769 × 477; 16 KB
-
 Verkiezingen Tessenderlo.jpg 680 × 500; 54 KB
-
 Visifire.jpg 380 × 229; 19 KB
-
 Waldorf iskolák növekedése.png 677 × 525; 9 KB
-
 Waldorf schools growth.png 463 × 363; 10 KB
-
 Waldorf-schools-growth.png 677 × 525; 9 KB
-
 Where Cyberbullying Is Occuring-ar.jpg 506 × 325; 80 KB
-
 Where Cyberbullying Is Occuring.jpg 506 × 325; 35 KB
-
 WINWIKI-5.png 360 × 252; 22 KB
-
 Work UN.png 435 × 289; 8 KB


.jpg)


.png)


.png)


_w_%C5%81odzi_w_latach_1975-2005.png)
_schools_in_%C5%81%C3%B3d%C5%BA_in_1975-2005.png)


.PNG)
.PNG)
.PNG)


