Category:Vertical histograms
Media in category "Vertical histograms"
The following 200 files are in this category, out of 324 total.
(previous page) (next page)-
 -10 Math.JPG 546 × 416; 17 KB
-
 -10 Reading.jpg 546 × 416; 18 KB
-
 -16 histo.JPG 746 × 567; 19 KB
-
 -8 Histogram.JPG 685 × 522; 20 KB
-
 1-bayes-prior.svg 1,080 × 900; 38 KB
-
 2016 Profile of Renewable Electric Energy.jpg 480 × 289; 41 KB
-
 2016 Top HYDRO States.jpg 480 × 289; 31 KB
-
 20201112 Tidal flooding graph - Annapolis, Maryland.svg 900 × 675; 2 KB
-
 27 Histogramo.svg 512 × 512; 2 KB
-
 Active editors WN-RU 11 2022.png 1,624 × 705; 33 KB
-
 Age distribution at Topaz 1943.png 600 × 375; 11 KB
-
 AkkaTechnologies - histogramme des ages employes 2013.png 772 × 590; 17 KB
-
 Alder for stortingsrepresentanter 2013-2017.png 800 × 600; 40 KB
-
 Alignment Shuffling for Identity.jpg 434 × 400; 43 KB
-
 Altuerak histograma.png 480 × 480; 10 KB
-
 Anthrax3.png 317 × 318; 10 KB
-
 Arrival time AUC approximation.svg 588 × 355; 83 KB
-
 AverageShiftedHistogram.png 700 × 700; 2 KB
-
 AverageShiftedHistogram.svg 630 × 630; 30 KB
-
 Azuara-impact-structure-PDF histogram.jpg 468 × 392; 47 KB
-
 Banakuntza normala histograma 01.png 480 × 480; 15 KB
-
 Barchart toomuch histogram.svg 1,300 × 500; 16 KB
-
 Bauer97.jpg 480 × 462; 23 KB
-
 Bigomegahist1e7.svg 600 × 480; 27 KB
-
 Bimodal-histogram.png 541 × 332; 9 KB
-
 Black cherry tree histogram no title.svg 216 × 216; 3 KB
-
 Black cherry tree histogram.svg 216 × 216; 4 KB
-
 Bliss - hue histogram.svg 913 × 476; 237 KB
-
 Blue noise histogram.svg 600 × 480; 67 KB
-
 Car2008.PNG 677 × 286; 12 KB
-
 Chart Umsatz Einhell 2011-2021.jpg 931 × 584; 55 KB
-
 Courbe épidémique avec cas cumulés.jpg 415 × 250; 14 KB
-
 CricketBattingAverageHistogram.png 1,000 × 1,136; 146 KB
-
 CTICM - Revue Construction Métallique - Analyse.png 1,701 × 1,100; 42 KB
-
 Cumulative vs normal histogram cz.svg 900 × 450; 67 KB
-
 Cumulative vs normal histogram.svg 900 × 450; 52 KB
-
 David Bruce; Graphs Wellcome L0020994.jpg 1,443 × 1,309; 341 KB
-
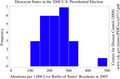 Democrat abortion ratio.png 720 × 472; 45 KB
-
 DeNovoVelvet Fig1.JPG 2,400 × 900; 75 KB
-
 Densite-ex.png 564 × 563; 3 KB
-
 Densityhisto.png 1,123 × 622; 43 KB
-
 Dentsitate histograma 0001.png 1,400 × 500; 36 KB
-
 Dist normal 2.png 701 × 562; 60 KB
-
 Dist Normal.png 745 × 597; 68 KB
-
 Distribution of End Uses.png 1,069 × 764; 80 KB
-
 Dog food histogram 01.png 480 × 480; 5 KB
-
 Dogs reaction time.JPG 719 × 431; 24 KB
-
 Dynamics of the attendance of ru-wikinews up to 11.2022.jpg 1,498 × 733; 96 KB
-

-
-
 Ekscesas.png 230 × 547; 10 KB
-
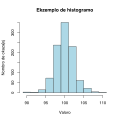 Ekzemplo de histogramo.svg 450 × 450; 50 KB
-
 EMK M21global4local2 Peak4LenaEBM.pdf 1,081 × 864; 52 KB
-
 EMK M21global4local2 Peak4LenaPDF.pdf 1,081 × 866; 36 KB
-
 EMK M21global4local2 Peak4TestImages.pdf 1,068 × 779; 77 KB
-
 EMK M5global4local2 Peak2.pdf 1,081 × 864; 19 KB
-
 EMK M8global4local2 Peak5.pdf 1,081 × 864; 17 KB
-
 EMK Peak2mu2a35b2 RandLocalBandWidth.pdf 1,064 × 854; 96 KB
-
 EMK RandMixGGDPeaks1Range6Beta25-4 TvarTruePDF.pdf 1,064 × 854; 13 KB
-
 EMK RandMixGGDPeaks2Range6Beta25-4 TvarKL.pdf 1,100 × 875; 7 KB
-
 EMK RandMixGGDPeaks2Range6Beta25-4 TvarM.pdf 1,070 × 862; 6 KB
-
 EMK RandMixGGDPeaks2Range6Beta25-4 TvarT.pdf 1,100 × 875; 7 KB
-
 EMK RandMixGGDPeaks2Range6Beta25-4 TvarTruePDF.pdf 1,064 × 854; 13 KB
-
 Eruptive history of the Mount Meager Volcanic Complex.png 671 × 527; 23 KB
-
 Example histogram.png 300 × 350; 12 KB
-
 Exemple d histogramme.png 314 × 206; 1 KB
-
 Exemple histogramme.svg 610 × 460; 57 KB
-
 Exemplo01-tableu-histo1.png 1,355 × 717; 64 KB
-
 EXP PDF.pdf 1,081 × 866; 22 KB
-
 Fa histogram logged data.png 499 × 419; 14 KB
-
 Fa history histogram.png 531 × 430; 15 KB
-
 Fico histogram.svg 720 × 483; 9 KB
-
 Fico histogram2.svg 900 × 720; 66 KB
-
 Histogram of films by year.svg 512 × 512; 42 KB
-
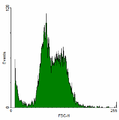
 Flow cytometry 3Dhistogram.png 375 × 256; 99 KB
-
 Flow cytometry histogram.png 266 × 268; 4 KB
-
 FR epa service 2003-2008 average image output per day.png 977 × 600; 24 KB
-
 Gaussian white noise histogram.svg 600 × 480; 68 KB
-
 German Wind and Solar Generation Histogram-Equal Annual.svg 800 × 600; 7 KB
-
 German Wind and Solar Generation Histogram-Equal Max Daily.svg 800 × 600; 7 KB
-
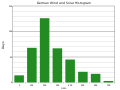 German Wind and Solar Generation Histogram.svg 800 × 600; 7 KB
-
 Gohana-Interval.jpg 640 × 480; 36 KB
-
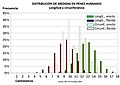 Grafico medidas de penes humanos.jpg 952 × 674; 96 KB
-
 Grafische Darstellung der in Stöckey bekleideten Pfarrämter..jpg 825 × 340; 59 KB
-
-
 Helmert02-05.jpeg 672 × 672; 103 KB
-
 Helmert05.jpeg 672 × 672; 94 KB
-
 Heterogeneotasuna.pdf 900 × 900; 4 KB
-
 Hirschuv index.png 709 × 544; 5 KB
-
 Hist cz-wa.jpg 640 × 400; 20 KB
-
 HIST IWD 1.png 800 × 597; 30 KB
-
 HIST IWD 2.png 800 × 597; 26 KB
-
 HIST IWD 3.png 800 × 597; 26 KB
-
 HIST IWD 4.png 800 × 597; 26 KB
-
 HIST IWD 5.png 800 × 597; 26 KB
-
 Hist licheń.jpg 640 × 400; 14 KB
-
 HIST NEAREST.png 800 × 597; 26 KB
-
 HIST objectivo vs dados.png 800 × 597; 23 KB
-
 HistCounts.png 387 × 266; 4 KB
-
 HistDens.png 403 × 266; 6 KB
-
 HistFreq.png 403 × 266; 5 KB
-
 HistFreqPoly.JPG 326 × 255; 17 KB
-
 Histo alimentaire.png 825 × 499; 16 KB
-
 Histo alimentaire.svg 780 × 580; 19 KB
-
 Histo-discr.png 564 × 563; 4 KB
-
 Histo.png 1,000 × 839; 20 KB
-
 Histogram (tr).png 800 × 750; 13 KB
-
 Histogram example.svg 361 × 289; 6 KB
-
 Histogram from cytometry - aneuploidy.PNG 467 × 336; 9 KB
-
 Histogram from cytometry - diploidy.PNG 639 × 400; 9 KB
-
 Histogram from cytometry - hyperdiploidy.PNG 575 × 389; 9 KB
-
 Histogram from cytometry - hypertetraploidy.PNG 594 × 416; 13 KB
-
 Histogram from cytometry - hypodiploidy.PNG 552 × 340; 8 KB
-
 Histogram from cytometry - poliiploidy octaploidy.PNG 419 × 313; 8 KB
-
 Histogram from cytometry - tetraploidy.PNG 613 × 430; 13 KB
-
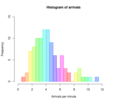 Histogram of arrivals per minute.png 1,024 × 867; 119 KB
-
 Histogram of arrivals per minute.svg 614 × 520; 175 KB
-
 Histogram of imagemEqualizada.tif 300 × 240; 211 KB
-
 Histogram of Japanese wikipedia article "Histogram" page views.png 557 × 491; 15 KB
-
 Histogram of MyTableInMyHomeOffice.tif 300 × 240; 211 KB
-
 Histogram of protections on English Wikipedia, October 18 2018.png 671 × 501; 19 KB
-
 Histogram of protections on German Wikipedia, October 18 2018.png 600 × 502; 16 KB
-
 Histogram of ursos.tif 300 × 240; 211 KB
-
 Histogram of ursosEqualizada.tif 300 × 240; 211 KB
-
 Histogram Picture.jpg 166 × 150; 5 KB
-
 Histogram showing bimodal distribution. 02.jpg 555 × 335; 38 KB
-
 Histogram showing bimodal distribution. 03.jpg 253 × 146; 10 KB
-
 Histogram showing normal distribution.jpg 244 × 136; 10 KB
-
 Histogram showing skewed left distribution.jpg 555 × 335; 39 KB
-
 Histogram showing skewed right distribution. 01.jpg 555 × 336; 38 KB
-
 Histogram showing skewed right distribution. 02.jpg 253 × 123; 8 KB
-
 Histogram showing uniform distribution.jpg 262 × 132; 9 KB
-
 Histogram.gif 333 × 212; 3 KB
-
 Histogram.jpg 512 × 384; 40 KB
-
 Histograma 001.png 480 × 480; 3 KB
-
 Histograma 003.png 480 × 480; 2 KB
-
 Histograma 004.png 480 × 480; 2 KB
-
 Histograma 005.png 480 × 480; 2 KB
-
 Histograma alboratua eskuin 01.png 480 × 480; 5 KB
-
 Histograma bimodala 001.png 480 × 480; 3 KB
-
 Histograma cumulado.png 502 × 435; 16 KB
-

-

-
 Histograma de frequência.png 636 × 523; 17 KB
-
 Histograma de tempo de viagem - dados absolutos.svg 935 × 354; 1,008 KB
-
 Histograma de tempo de viagem - proporção.svg 935 × 354; 1.07 MB
-
 Histograma denborak 01.png 480 × 480; 3 KB
-
 Histograma dentsitateak gridtable.pdf 1,800 × 900; 5 KB
-
 Histograma dentsitateekin 2016.png 480 × 480; 24 KB
-
 Histograma origin.png 400 × 307; 3 KB
-
 Histograma peso neonatos.png 629 × 504; 23 KB
-
 Histograma pisuaktom.JPG 861 × 484; 29 KB
-
 Histograma poligono de frequencias.png 400 × 307; 4 KB
-
 Histograma tarte zabalera desberdina 001.pdf 1,050 × 1,050; 12 KB
-
 Histograma tarte zabalera desberdina 002.png 900 × 400; 10 KB
-
 Histograma tarteen eragina 001.png 480 × 480; 15 KB
-
 Histograma wiki1.png 400 × 307; 4 KB
-
 Histograma wiki5.png 400 × 307; 6 KB
-
 Histograma1.svg 354 × 283; 599 KB
-
 Histograma2.svg 354 × 283; 470 KB
-
 Histogramgx.jpg 288 × 177; 7 KB
-
 Histogramm-1.gif 272 × 122; 2 KB
-
 Histogramme 1.svg 554 × 309; 10 KB
-
 Histogramme decentrei inf.svg 688 × 475; 13 KB
-
 Histogramme IDH 2021.svg 576 × 432; 30 KB
-
 Histogramme lissage.png 256 × 189; 2 KB
-
 Histogramme loi normale.svg 563 × 438; 17 KB
-
 Histogramme noncapable.svg 688 × 475; 13 KB
-
 Histogramme proche loin.svg 563 × 438; 8 KB
-
 Histogramme proche.svg 563 × 438; 8 KB
-
 Histogramme regle.svg 688 × 475; 13 KB
-
 Histogramme taille.svg 725 × 625; 22 KB
-
 Histogramme tirage aléatoire normale 100 valeurs GNU R.svg 687 × 639; 50 KB
-
 Histogramme tri inf.svg 563 × 438; 6 KB
-
 HistogrammeKilos.png 468 × 244; 9 KB
-
 HistogrammeKilosLisse1.png 468 × 248; 15 KB
-
 HistogrammeKilosLisse2.png 468 × 248; 14 KB
-
 Histograms of Bone Scan and Radiograph.jpg 660 × 201; 14 KB
-
 Histograms of pixel values in a bone scan and radiograph.gif 620 × 231; 11 KB
-
 Histograms of pixel values in a bone scan and radiograph.jpg 660 × 201; 13 KB
-
 HistoryResearchHistogramIntermediate.png 283 × 279; 10 KB
-
 HistoryResearchHistogramNewerrev.png 280 × 285; 9 KB
-
 Housingprice.png 479 × 383; 14 KB
-
 Human penis sizes girth only.svg 887 × 543; 235 KB
-
 Human penis sizes length only.svg 887 × 543; 34 KB
-
 Human penis sizes.svg 887 × 543; 249 KB
-
 I8 3d Histogram.PNG 1,036 × 911; 98 KB
-
 Ic-1a-original-histogram.jpg 450 × 298; 16 KB
-
 In-degree-histogram.png 638 × 372; 14 KB
-
 Inner-browser-width-2006.png 533 × 130; 3 KB
-
 Insolation kosovo.jpg 536 × 532; 37 KB
-
 IQ - distribuição assimétrica.gif 650 × 469; 405 KB
-
 IQ - distribuição simétrica.gif 650 × 468; 409 KB
-
 Iris Petal Length Histogram.svg 346 × 165; 5 KB
-
 Istogramma con i 3D.png 496 × 314; 15 KB
-
 Japanese Wikipedia Million Articles Histogram.svg 1,400 × 700; 282 KB
-
 JL Density Distribution linear q Histogramm.png 473 × 289; 21 KB
-
 Journal.pone.0010552.g005.tif 2,015 × 1,110; 298 KB
-
 Julia-histogram.png 712 × 534; 32 KB
-
 Katowice - klimat.svg 445 × 289; 22 KB


.png)


