File:Обеспыливание 2012 Рис. 3.8. Графики математической модели, позволяющие оценить концентрацию пыли.jpg

Original file(1,024 × 1,003 pixels, file size: 282 KB, MIME type: image/jpeg)

Captions

Captions

Add a one-line explanation of what this file represents

Summary

edit
Description
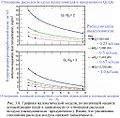
Русский: Иллюстрация к учебнику по обеспыливанию при добыче и переработке полезных минеральных ископаемых, глава 3. На Рис. 3.8 показано, как по расчётам должны влиять на концентрацию пыли отношение расходов воздуха, и относительный размер зазора.
English: Figure 3.8. Graphs of the model that represents the severity of dust emissions based upon collector to bailing airflow ratios, showing that the respirable dust concentrations become lower as the collector to bailing airflow ratio increases.
Date
Source Dust Control Handbook for Industrial Minerals Mining and Processing (CDC 2012)
Author Andrew B. Cecala, Andrew D. O’Brien, Joseph Schall et al.

Рис. 3.8. Графики математической модели, позволяющие оценить концентрацию пыли в зависимости от отношения расходов воздуха (пылеуловителя/продувочного). Видно, что увеличение отношения расходов воздуха снижает запылённость.


Licensing

edit
Public domain
This image is a work of the Centers for Disease Control and Prevention, part of the United States Department of Health and Human Services, taken or made as part of an employee's official duties. As a work of the U.S. federal government, the image is in the public domain.

File history

Click on a date/time to view the file as it appeared at that time.

Date/TimeThumbnailDimensionsUserComment
current11:46, 2 February 2015Thumbnail for version as of 11:46, 2 February 20151,024 × 1,003 (282 KB)AlexChirkin (talk | contribs)User created page with UploadWizard

There are no pages that use this file.

File usage on other wikis

The following other wikis use this file: