File:11 key indicators of global warming from State of the Climate 2009 (Kennedy et al., 2010).png

Size of this preview: 522 × 600 pixels. Other resolutions: 209 × 240 pixels | 418 × 480 pixels | 669 × 768 pixels | 892 × 1,024 pixels | 1,589 × 1,825 pixels.
Original file (1,589 × 1,825 pixels, file size: 298 KB, MIME type: image/png)
Captions
Captions
Add a one-line explanation of what this file represents
Summary
edit.png&action=edit§ion=1)
| Description |
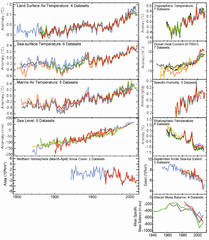
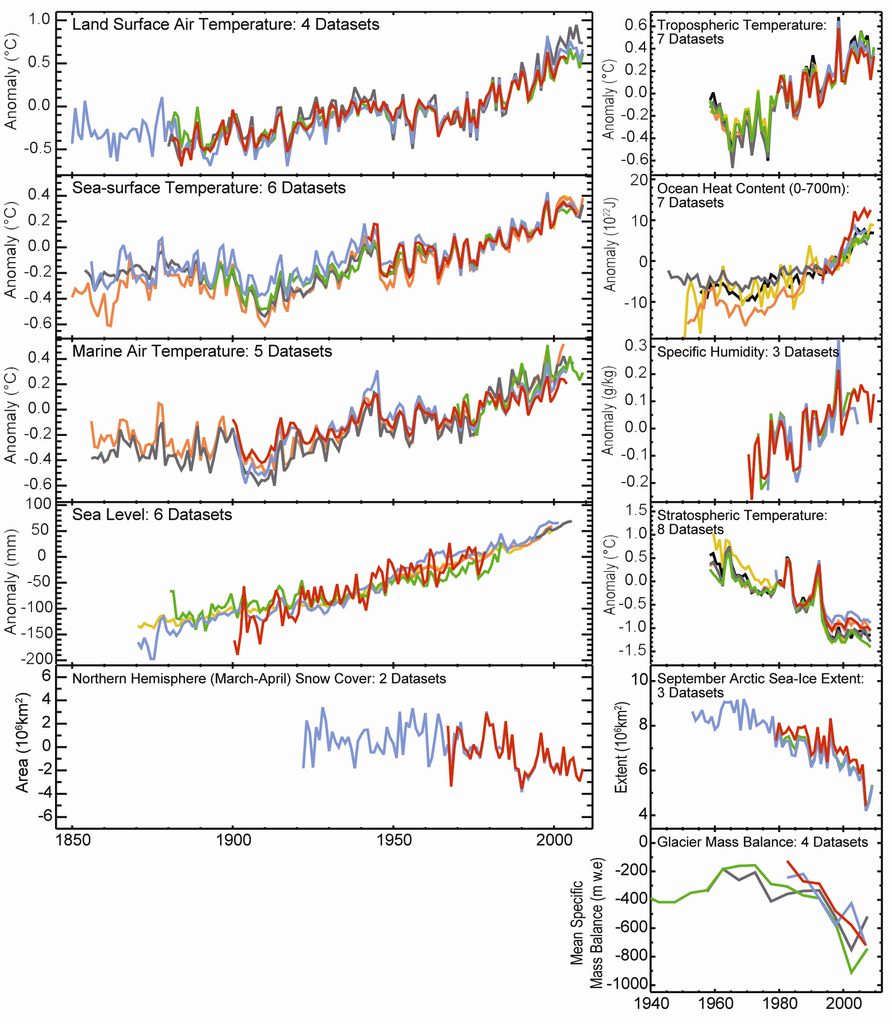
English: This image shows 11 graphs of data that are key indicators of global warming. The indicators all show long-term trends that are consistent with global warming. The datasets can be viewed individually and freely downloaded from NOAA (2012). More information on the datasets can be found in Willett et al. (2010) (see also effects of global warming). In brackets are the number of datasets (d.s.) shown in each graph, followed by the approximate length of time covered by the longest dataset: land surface air temperature (4 d.s., ~1850-2007), warming trend; sea-surface temperature (6 d.s., ~1855-2007), warming trend; marine air temperature (5 d.s., ~1860-2007), warming trend; sea level (6 d.s., ~1870-2005), increase; Northern Hemisphere (March-April) snow cover (2 d.s., ~1920-2007), decrease; tropospheric temperature (7 d.s., ~1960-2007), warming trend; ocean heat content (0-700m) (7 d.s., ~1950-2007), increase; specific humidity (3 d.s., ~1970-2007), increase; stratospheric temperature (8 d.s., ~1960-2007), cooling trend; September Arctic sea-ice extent (3 d.s., ~1950-2007), decrease; glacier mass balance (4 d.s., ~1940-2007), decrease. Edited quote from the public-domain source (for references see: Kennedy et al., 2010): "Although the Intergovernmental Panel on Climate Change concluded that “warming of the climate system is unequivocal,” public debate over the evidence for global warming continues. However, it is often confined to a small set of reiterated disputes about Land Surface Air Temperature (LSAT) records, diverting attention from the broader evidence basis. The methods used to derive the principal estimates of global surface temperature trends — HadCRUT3, NOA A, and NASA/GISS — are largely independent. So, the spread of the three estimates indicates the likely degree of uncertainty in the evolution of the global mean surface temperature. Independently derived estimates of tropospheric temperature trends for the whole troposphere channel from satellites differ by an order of magnitude more than do estimated surface temperature trends. Numerous studies attest to the robustness of the global LSAT records and their non-reliance on individual stations. Evidence from recent re-analyses lends further support. The IPCC conclusion that “warming of the climate system is unequivocal” does not rest solely upon LSAT records. These constitute only one line of evidence among many, for example: uptake of heat by the oceans, melting of land ice such as glaciers, the associated rise in sea level, and increased atmospheric surface humidity. If the land surface records were systematically flawed and the globe had not really warmed, then it would be almost impossible to explain the concurrent changes in this wide range of indicators produced by many independent groups. The observed changes in a broad range of indicators provide a self-consistent story of a warming world." References: Kennedy, J.J., et al., (2010): How do we know the world has warmed? in: 2. "Global Climate," in: "State of the Climate in 2009". Bull.Amer.Meteor.Soc., 91 (7), S26; NOAA (2012): Climate Indicators for Chapter 2 sidebar "How do we know the world has warmed?" in State of the Climate 2009, National Oceanic and Atmospheric Administration, National Climatic Data Center; Willett, K.M., et al., eds., (2010): Table 2.1, in: 2. "Global Climate," in: "State of the Climate in 2009". Bull.Amer.Meteor.Soc., 91 (7), S22 |
| Date | |
| Source | Kennedy, J.J., et al., (2010): How do we know the world has warmed? in: 2. "Global Climate," in: "State of the Climate in 2009". Bull.Amer.Meteor.Soc., 91 (7), S26 |
| Author | J. J. Kennedy, P. W. Thorne, T. C. Peterson, R. A. Ruedy, P. A. Stott, D. E. Parker, S. A. Good, H. A. Titchner, and K. M. Willett |
| Permission (Reusing this file) |
Privacy Policy, Disclaimer, and Copyright Notice: ngdc.noaa.gov: "As required by 17 U.S.C. 403, third parties producing copyrighted works consisting predominantly of the material produced by U.S. government agencies must provide notice with such work(s) identifying the U.S. Government material incorporated and stating that such material is not subject to copyright protection within the United States. The information on government web pages is in the public domain and not subject to copyright protection within the United States unless specifically annotated otherwise (copyright may be held elsewhere). Foreign copyrights may apply." |
Licensing
edit.png&action=edit§ion=2)
This image is in the public domain because it contains materials that originally came from the U.S. National Oceanic and Atmospheric Administration, taken or made as part of an employee's official duties.
|
File history
Click on a date/time to view the file as it appeared at that time.
| Date/Time | Thumbnail | Dimensions | User | Comment | |
|---|---|---|---|---|---|
| current | 20:54, 24 September 2016 | | 1,589 × 1,825 (298 KB) | Cmdrjameson (talk | contribs) | Compressed with pngout. Reduced by 232kB (43% decrease). |
| 02:26, 7 September 2012 |  | 1,589 × 1,825 (530 KB) | Enescot (talk | contribs) | {{Information |Description ={{en|1=This image shows 11 graphs of data that are key indicators of global warming. The indicators all show long-term trends that are consistent with global warming. The datasets can be viewed individually and freely dow... |
You cannot overwrite this file.
File usage on Commons
There are no pages that use this file.
File usage on other wikis
The following other wikis use this file:
- Usage on no.wikipedia.org
.png&oldid=868822298)