File:20190705 Warming stripes - Berkeley Earth (world) - avg above- and below-ice readings.png

Original file (3,200 × 1,800 pixels, file size: 42 KB, MIME type: image/png)
Captions
Captions
Summary
edit| Description |
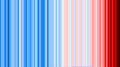
English: w:Warming stripes w:data visualization diagram that represents temperature deviations above (in red stripes) and below (in blue stripes) a 1951-1980 mean value.
General notes:
Source documentation re the underlying data:
Other datasets at Berkeley Earth:
Creator/Uploader's remarks:
|
||
| Date | |||
| Source | Own work | ||
| Author | RCraig09 | ||
| Other versions |
This basic warming stripes graphic is incorporated into the following images:
|
.png)
_vs_World_(Berkeley_Earth_1850-2018).png)


.png)
Related files
edit-
 20190705 Warming stripes - Berkeley Earth (world) - avg above- and below-ice readings.png
PNG predecessor (early version, not using ColorBrewer hues) -
 1850- Warming stripes - global average surface temperature.svg
SVG successor -
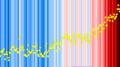 20190705 Warming stripes BEHIND line graph - Berkeley Earth (world).png
PNG predecessor (early version, not using ColorBrewer hues) -
 20240311 Warming stripes BEHIND line chart - global surface temperature.svg
SVG - warming stripes behind conventional line chart -
 20240625 Global warming across generations - warming stripes.svg
warming stripes juxtaposed with generations in history -
 Generation_timeline.svg
2020-, relevant to timing of different generations
_-_avg_above-_and_below-ice_readings.png)


_-_avg_above-_and_below-ice_readings.png&action=edit§ion=1)
_-_avg_above-_and_below-ice_readings.png&action=edit§ion=2)
Licensing
edit_-_avg_above-_and_below-ice_readings.png&action=edit§ion=3)
- You are free:
- to share – to copy, distribute and transmit the work
- to remix – to adapt the work
- Under the following conditions:
- attribution – You must give appropriate credit, provide a link to the license, and indicate if changes were made. You may do so in any reasonable manner, but not in any way that suggests the licensor endorses you or your use.
- share alike – If you remix, transform, or build upon the material, you must distribute your contributions under the same or compatible license as the original.
File history
Click on a date/time to view the file as it appeared at that time.
| Date/Time | Thumbnail | Dimensions | User | Comment | |
|---|---|---|---|---|---|
| current | 02:46, 31 July 2019 | | 3,200 × 1,800 (42 KB) | RCraig09 (talk | contribs) | Including thin purple bar (lower edge) to delineate the 1951-1980 reference period, whose average determines red-blue boundary. |
| 16:22, 5 July 2019 |  | 3,200 × 1,800 (42 KB) | RCraig09 (talk | contribs) | Made stripes much more evenly spaced (consistently the same width). Possibly added a stripe for a year that was missing from Version One. | |
| 02:55, 5 July 2019 |  | 3,200 × 1,800 (93 KB) | RCraig09 (talk | contribs) | User created page with UploadWizard |
You cannot overwrite this file.
File usage on Commons
The following 12 pages use this file:
- User:RCraig09
- File:1850- Warming stripes - global average surface temperature.svg
- File:20190705 Warming stripes - Berkeley Earth (world) - avg above- and below-ice readings.png
- File:20190705 Warming stripes BEHIND line graph - Berkeley Earth (world).png
- File:20190706 Compare warming stripes - Azores (GISTEMP 250 1880-2017) vs World (Berkeley Earth 1850-2018).png
- File:20190707 Compare warming stripes - HadCRUT vs Berkeley Earth - both 1961-1990 ref period.png
- File:20190707 Compare warming stripes - three reference periods.png
- File:20190709 Compare warming stripes - 0.10 vs 0.15 C per color.png
- File:20190711 Comparing warming stripes - GISS, GHCN-v3, HadCRUT4.6.0.0, Berkeley Earth (1961-1990 ref).png
- File:20190812 Warming stripe barnstar 2000x1900.png
- File:20240311 Warming stripes BEHIND line chart - global surface temperature.svg
- File:20240625 Global warming across generations - warming stripes.svg
File usage on other wikis
The following other wikis use this file:
- Usage on arz.wikipedia.org
- Usage on bn.wikipedia.org
- Usage on ja.wikipedia.org
_-_avg_above-_and_below-ice_readings.png&oldid=891568927)