File:20210822 Global warming - warming stripes bar chart.svg

Original file (SVG file, nominally 1,000 × 750 pixels, file size: 14 KB)
Captions
Captions
Summary
edit| Description |
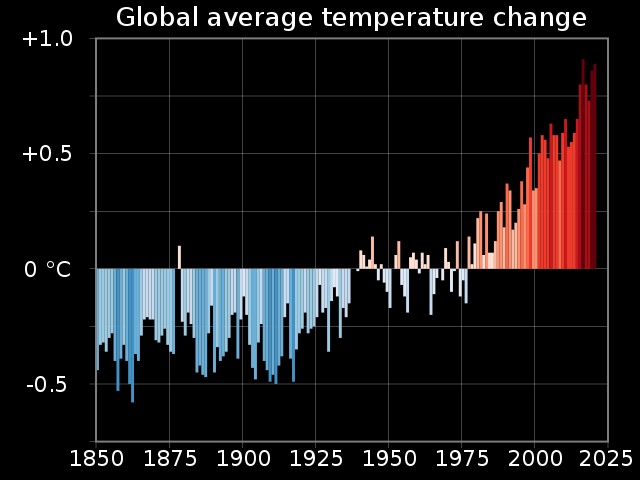
English: Vertical bar chart showing global average temperature change, with each bar/column being coloured according to the Warming stripes colouring scheme of Ed Hawkins (climatologist, who conceived the idea of warming stripes.
 Warming stripes (five examples compared) Warming stripes bar chart Bar chart (vertical) Pie chart Line charts Scatterplot I've uploaded .xlsx (Microsoft Excel) spreadsheets that automatically generate XML code for charts in SVG format. You simply paste or enter your data into the spreadsheet, and specify image dimensions, number of grid lines, font sizes, etc. The spreadsheet instantly and automatically generates a column of XML code that you simply copy and paste into a text editor and save as an ".svg" file. The spreadsheets produce lean SVG code, avoiding the "extra stuff" that Inkscape inserts. They should save you time in creating SVG charts. Feedback and suggestions on my talk page are welcome. RCraig09 (talk) 23:41, 19 February 2021 (UTC) Click HOW TO for detailed explanation.
Example SVG files: Category:SVG diagrams created with spreadsheet.
|
| Date | |
| Source | Own work |
| Author | RCraig09 |
| SVG development | This chart was created with an unknown SVG tool. |


Licensing
edit
- You are free:
- to share – to copy, distribute and transmit the work
- to remix – to adapt the work
- Under the following conditions:
- attribution – You must give appropriate credit, provide a link to the license, and indicate if changes were made. You may do so in any reasonable manner, but not in any way that suggests the licensor endorses you or your use.
- share alike – If you remix, transform, or build upon the material, you must distribute your contributions under the same or compatible license as the original.
File history
Click on a date/time to view the file as it appeared at that time.
| Date/Time | Thumbnail | Dimensions | User | Comment | |
|---|---|---|---|---|---|
| current | 20:41, 8 August 2022 | | 1,000 × 750 (14 KB) | Sebastian Wallroth (talk | contribs) | File uploaded using svgtranslate tool (https://svgtranslate.toolforge.org/). Added translation for de. |
| 20:28, 23 August 2021 |  | 1,000 × 750 (12 KB) | RCraig09 (talk | contribs) | Version 2: narrowing vertical scale so trace occupies more of image | |
| 04:03, 23 August 2021 |  | 1,000 × 750 (13 KB) | RCraig09 (talk | contribs) | Uploaded own work with UploadWizard |
You cannot overwrite this file.
File usage on Commons
The following 22 pages use this file:
- User:RCraig09
- User:RCraig09/Excel to XML for SVG
- User talk:RCraig09
- User talk:RCraig09/Archive 1 (2009-2021)
- Commons:Graphic Lab/Illustration workshop/Archive/2021
- File:1981–1989 monthly unemployment, inflation, and interest rates.svg
- File:2011- Renewable energy capacity - International Energy Agency-cs.svg
- File:20200324 Global average temperature - NASA-GISS HadCrut NOAA Japan BerkeleyE.svg
- File:20210331 Global tree cover loss - World Resources Institute-cs.svg
- File:20210502 Warming stripes comparison of Global Mean Surface Temperature datasets.svg
- File:20210507 Warming stripes - ellipses - global warming.svg
- File:20210507 Warming stripes - octagons - global warming.svg
- File:20210507 Warming stripes - rectangles - global warming.svg
- File:20210507 Warming stripes - triangles - global warming.svg
- File:20210508 Warming stripes - hexagons - global warming.svg
- File:20210517 Warming stripes - pentagrams - stars - global warming.svg
- File:20210522 Warming stripes - longitudes - meridians on a globe - global warming.svg
- File:20210526 Warming stripes - hearts - global warming.svg
- File:20210530 Warming stripes - diamonds - global warming.svg
- File:20210604 Warming stripes - XLSX to SVG - various Diamond etc configurations - GIF.gif
- File:20210822 Global warming - warming stripes bar chart.svg
- File:20211109 Frequency of extreme weather for different degrees of global warming - bar chart IPCC AR6 WG1 SPM cs.svg
File usage on other wikis
The following other wikis use this file:
- Usage on en.wikipedia.org
- Talk:SVG
- Wikipedia:SVG help
- Talk:Data and information visualization
- User talk:RCraig09
- Warming stripes
- Talk:Warming stripes
- Wikipedia talk:WikiProject Countries/Archive 13
- Wikipedia talk:WikiProject Climate change/Archive 2
- Talk:Climate change/Archive 86
- User:RCraig09/Excel to XML for SVG
- User talk:RCraig09/Archive 2 (2020)
- Wikipedia:Graphics Lab/Illustration workshop/Archive/Apr 2021
- Passive daytime radiative cooling
- User talk:RCraig09/Archive 3 (2021-2022)
- User talk:RCraig09/Archive 4 (2023)
- Usage on gl.wikipedia.org
- Usage on he.wikipedia.org