File:Allan Lamb graph.png
Size of this preview: 800 × 466 pixels. Other resolutions: 320 × 186 pixels | 640 × 373 pixels | 986 × 574 pixels.
Original file (986 × 574 pixels, file size: 6 KB, MIME type: image/png)
Captions
Captions
Add a one-line explanation of what this file represents

|
This file was moved to Wikimedia Commons from en.wikipedia using a bot script. All source information is still present. It requires review. Additionally, there may be errors in any or all of the information fields; information on this file should not be considered reliable and the file should not be used until it has been reviewed and any needed corrections have been made. Once the review has been completed, this template should be removed. For details about this file, see below. Check now! |
Summary
edit
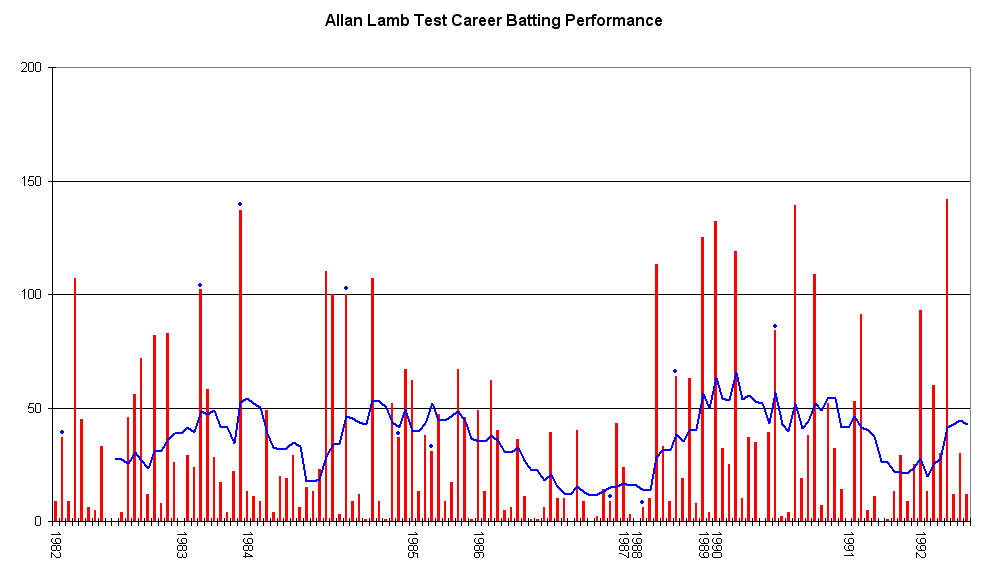
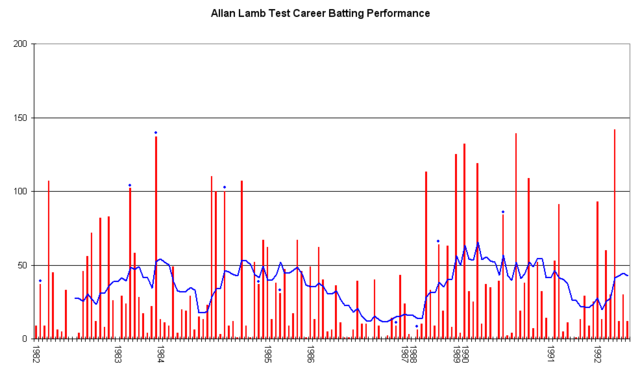
This graph details the Test Match performance of en:Allan Lamb. It was created by Raven4x4x. The red bars indicate the player's test match innings, while the blue line shows the average of the ten most recent innings at that point. Note that this average cannot be calculated for the first nine innings. The blue dots indicate innings in which Lamb finished not-out.
This graph was generated with Microsoft Excel 2002, using data from Cricinfo and Howstat.com.au.
Licensing
edit
| I, the copyright holder of this work, release this work into the public domain. This applies worldwide. In some countries this may not be legally possible; if so: I grant anyone the right to use this work for any purpose, without any conditions, unless such conditions are required by law. |
Original upload log
edit
The original description page was here. All following user names refer to en.wikipedia.
| Upload date | User | Bytes | Dimensions | Comment |
|---|---|---|---|---|
| 2007-12-16 02:14:38 | Raven4x4x | 5739 | 986×574 | This graph details the [[Test cricket|Test Match]] performance of [[Allan Lamb]]. It was created by [[User:Raven4x4x|Raven4x4x]]. The red bars indicate the player's test match innings, while the blue line shows the [[Batting average|average]] of the ten m |
File history
Click on a date/time to view the file as it appeared at that time.
| Date/Time | Thumbnail | Dimensions | User | Comment | |
|---|---|---|---|---|---|
| current | 18:49, 24 March 2010 | | 986 × 574 (6 KB) | Avicennasis (talk | contribs) | {{BotMoveToCommons|en.wikipedia|year={{subst:CURRENTYEAR}}|month={{subst:CURRENTMONTHNAME}}|day={{subst:CURRENTDAY}}}} == Summary == This graph details the Test Match performance of en:Allan Lamb. It was created by [[:en:User:Rav |
You cannot overwrite this file.
File usage on Commons
There are no pages that use this file.