File:Annual greenhouse gas emissions by sector, in 2010 (color)-da.png

Size of this preview: 750 × 600 pixels. Other resolutions: 300 × 240 pixels | 600 × 480 pixels | 960 × 768 pixels | 1,280 × 1,024 pixels | 1,500 × 1,200 pixels.
Original file (1,500 × 1,200 pixels, file size: 68 KB, MIME type: image/png)
Captions
Captions
Add a one-line explanation of what this file represents
Summary edit
-da.png&action=edit§ion=1)
| Description |
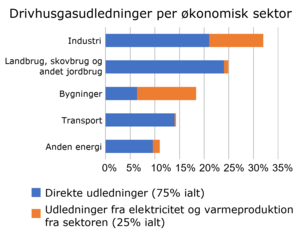
English: This graph shows annual greenhouse gas emissions (in 2010) attributed to different sectors. Emissions are given as a percentage share of total emissions, measured in carbon dioxide-equivalents, using global warming potentials from the Intergovernmental Panel on Climate Change's (IPCC) fifth Assessment Report. Data are tabulated in a later section. References *Figure SPM.2, in: Summary for Policymakers (archived 29 June 2014), p.7, in: IPCC AR5 WG3; Edenhofer, O., et al., ed. (2014). Climate Change 2014: Mitigation of Climate Change. Contribution of Working Group III (WG3) to the Fifth Assessment Report (AR5) of the Intergovernmental Panel on Climate Change (IPCC). Cambridge University Press.. Archived 29 June 2014. |
| Date | |
| Source |
This file was derived from: Annual greenhouse gas emissions by sector, in 2010 (color).png: |
| Author |
|
_png.png#Data)
.png)
| This is a retouched picture, which means that it has been digitally altered from its original version. The original can be viewed here: Annual greenhouse gas emissions by sector, in 2010 (color).png:
|
Licensing edit
-da.png&action=edit§ion=2)
I, the copyright holder of this work, hereby publish it under the following license:
| This file is made available under the Creative Commons CC0 1.0 Universal Public Domain Dedication. | |
| The person who associated a work with this deed has dedicated the work to the public domain by waiving all of their rights to the work worldwide under copyright law, including all related and neighboring rights, to the extent allowed by law. You can copy, modify, distribute and perform the work, even for commercial purposes, all without asking permission.
|
Original upload log edit
-da.png&action=edit§ion=3)
This image is a derivative work of the following images:
- File:Annual greenhouse gas emissions by sector, in 2010 (color).png licensed with Cc-zero
- 2019-02-05T19:26:05Z Efbrazil 1500x1200 (114057 Bytes) Added white background to graph area, darkened up percentage grid lines.
- 2019-02-05T00:35:46Z Efbrazil 1500x1200 (111885 Bytes) minor edit: slight font bump, tightened title
- 2019-02-02T22:16:44Z Efbrazil 1500x1215 (109702 Bytes) Changed to be legible on smartphone without zooming, changed layout to be more intuitive when reading.
- 2014-08-31T06:58:56Z Enescot 1200x831 (72682 Bytes) User created page with UploadWizard
Uploaded with derivativeFX
File history
Click on a date/time to view the file as it appeared at that time.
| Date/Time | Thumbnail | Dimensions | User | Comment | |
|---|---|---|---|---|---|
| current | 09:49, 26 April 2020 | | 1,500 × 1,200 (68 KB) | Brinchj (talk | contribs) | fix typo in "energi" |
| 19:33, 25 April 2020 |  | 1,500 × 1,200 (68 KB) | Brinchj (talk | contribs) | == {{int:filedesc}} == {{Information |Description={{en|1=This graph shows annual greenhouse gas emissions (in 2010) attributed to different sectors. Emissions are given as a percentage share of total emissions, measured in carbon dioxide-equivalents, using global warming potentials from the Intergovernmental Panel on Climate Change's (IPCC) fifth Assessment Report. Data are tabulated in... |
You cannot overwrite this file.
File usage on Commons
There are no pages that use this file.
File usage on other wikis
The following other wikis use this file:
- Usage on da.wikipedia.org
-da.png&oldid=796121687)