File:Anscombe's quartet.svg

Original file (SVG file, nominally 990 × 720 pixels, file size: 39 KB)
Captions
Captions
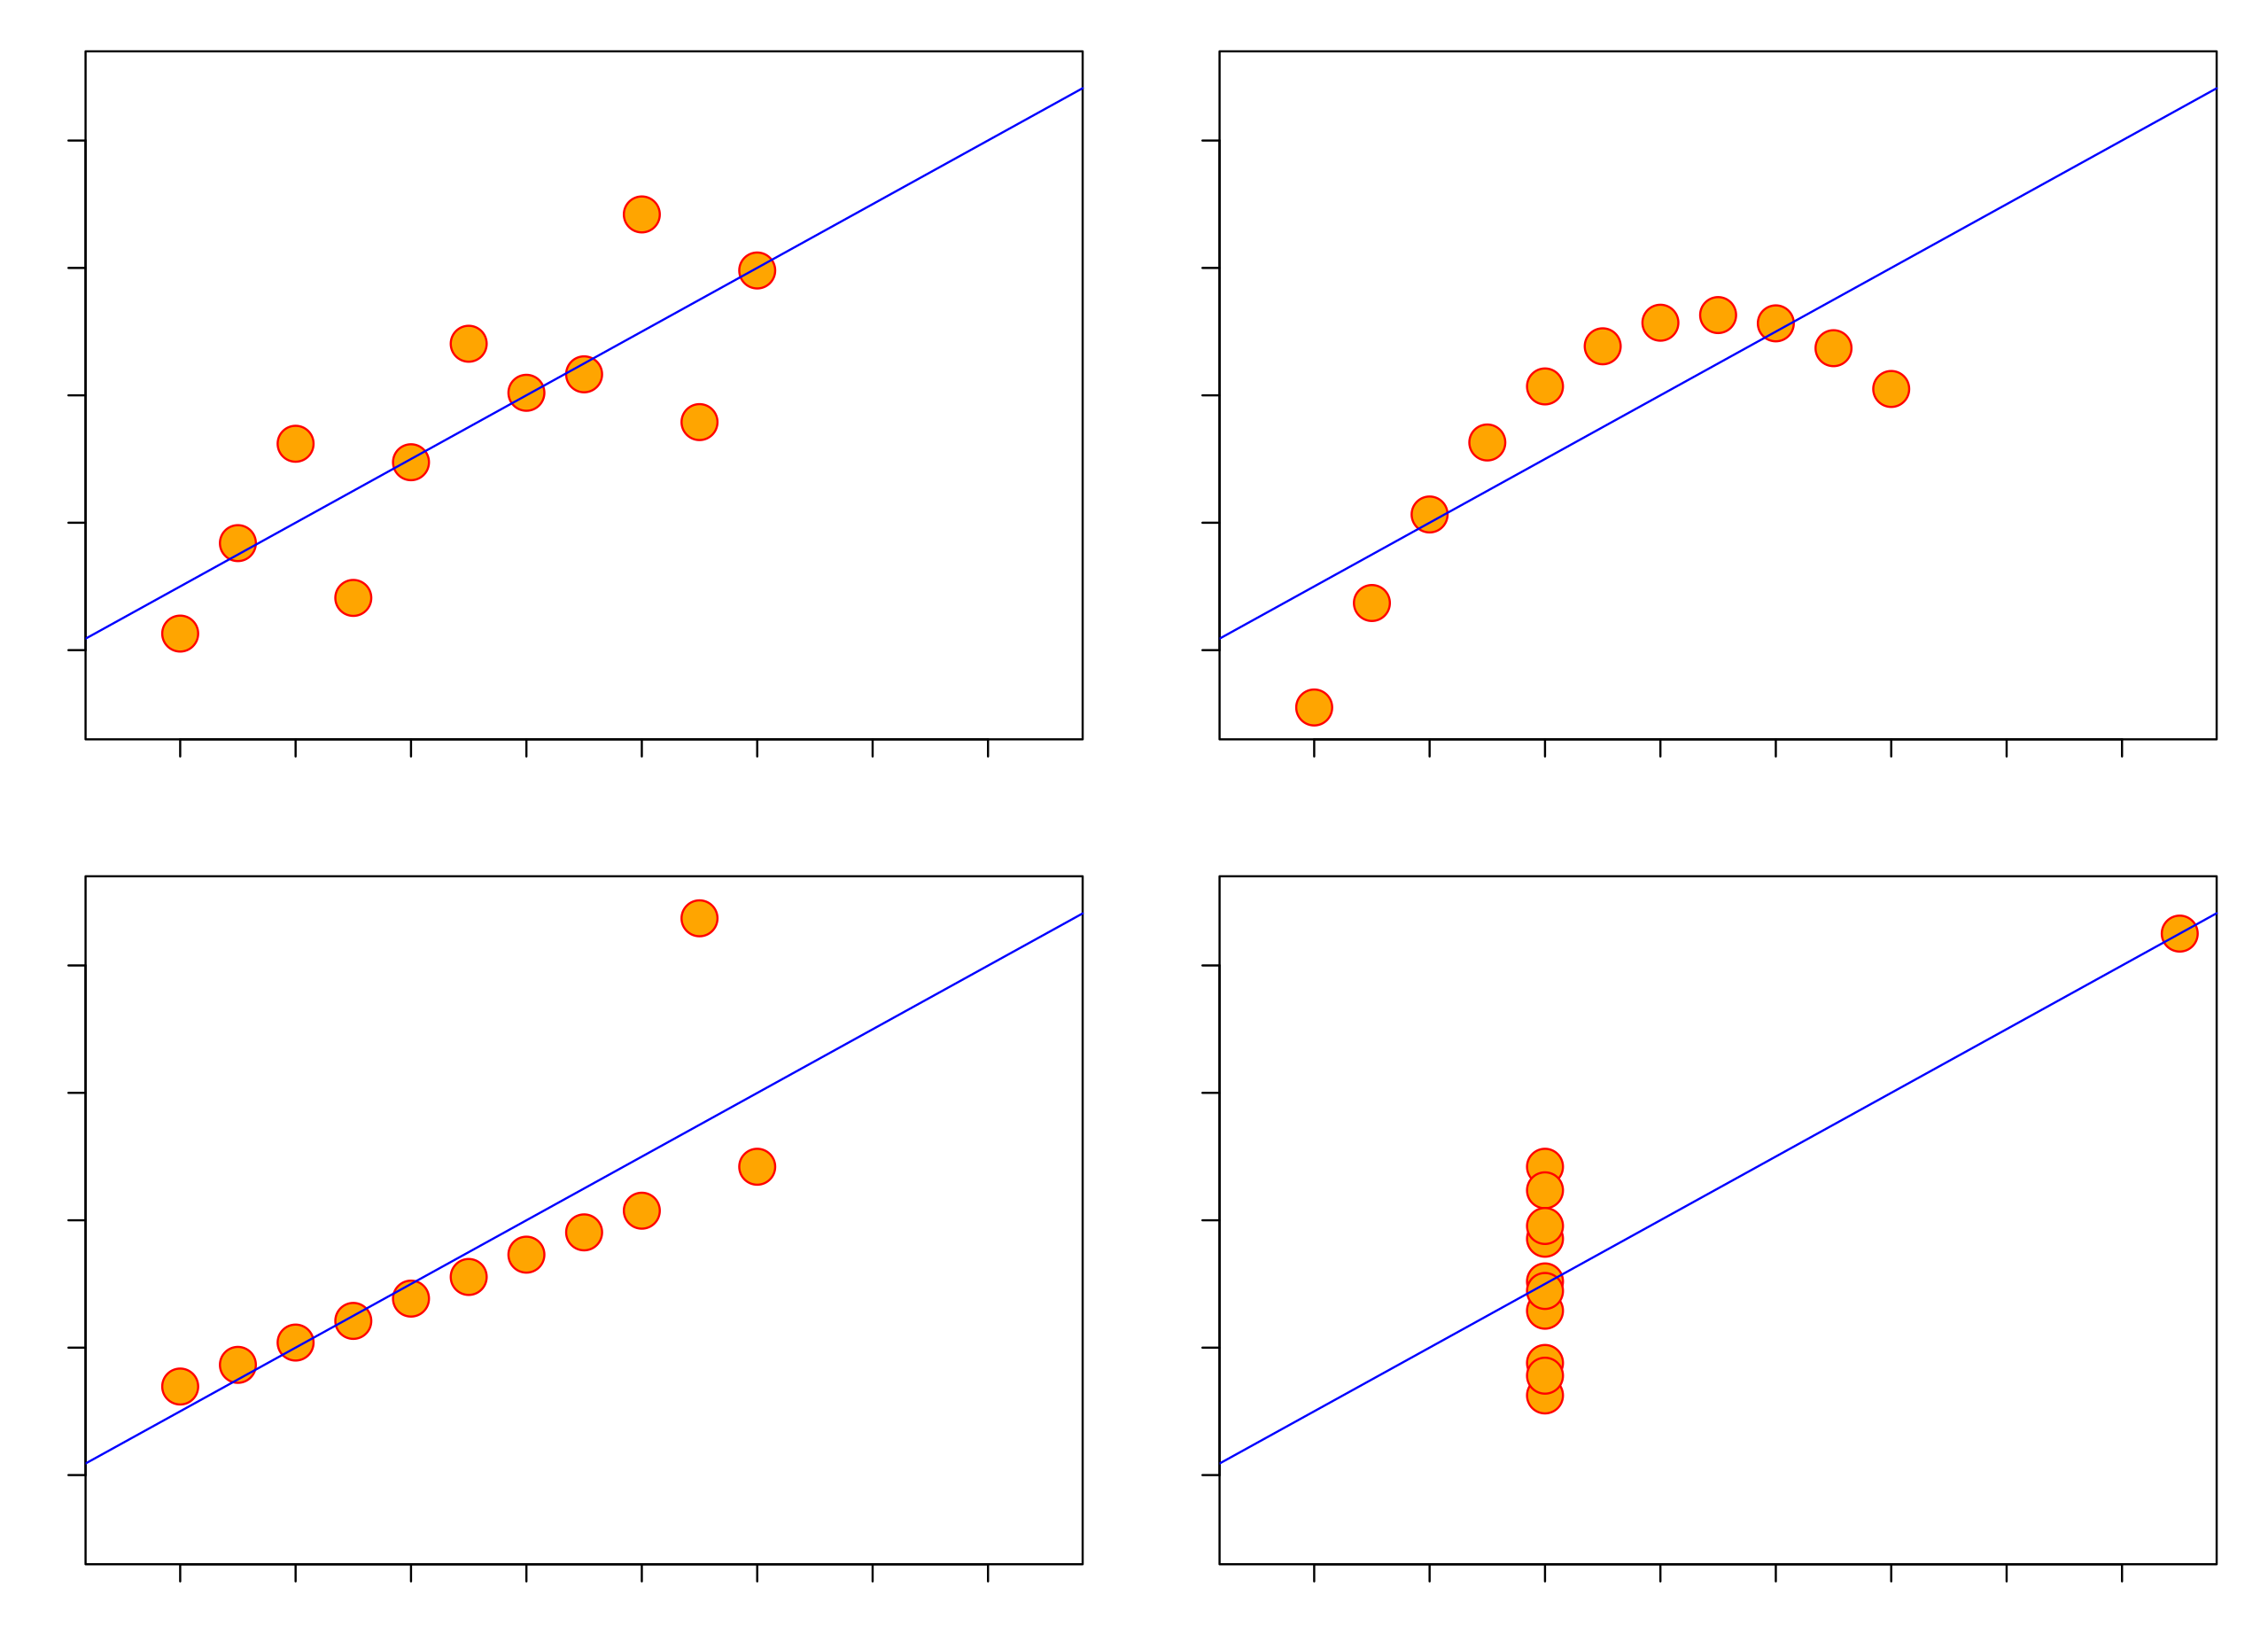
| Description | This graphic represents the four datasets defined by Francis Anscombe for which some of the usual statistical properties (mean, variance, correlation and regression line) are the same, even though the datasets are different. |
| Date | (UTC) |
| Source | |
| Author |
|
| SVG development |

|
This work is free software; you can redistribute it and/or modify it under the terms of the GNU General Public License as published by the Free Software Foundation; either version 2 of the License, or any later version. This work is distributed in the hope that it will be useful, but without any warranty; without even the implied warranty of merchantability or fitness for a particular purpose. See version 2 and version 3 of the GNU General Public License for more details. |
Original upload log edit
This image is a derivative work of the following images:
- File:Anscombe.svg licensed with GPL
Uploaded with derivativeFX
File history
Click on a date/time to view the file as it appeared at that time.
| Date/Time | Thumbnail | Dimensions | User | Comment | |
|---|---|---|---|---|---|
| current | 22:42, 25 March 2010 | | 990 × 720 (39 KB) | Avenue (talk | contribs) | Revert to black box and tickmarks |
| 22:41, 25 March 2010 |  | 990 × 720 (42 KB) | Avenue (talk | contribs) | Oops, tickmarks too. | |
| 22:34, 25 March 2010 |  | 990 × 720 (40 KB) | Avenue (talk | contribs) | Grey box and tickmarks, not black. | |
| 21:00, 25 March 2010 |  | 990 × 720 (39 KB) | Avenue (talk | contribs) | Less blank space below and left | |
| 20:42, 25 March 2010 |  | 990 × 720 (39 KB) | Avenue (talk | contribs) | {{Information |Description=This graphic represents the four datasets defined by Francis Anscombe for which some of the usual statistical properties (mean, variance, correlation and regression line) are the same, even though the datasets are different. |So |
You cannot overwrite this file.
File usage on Commons
There are no pages that use this file.
File usage on other wikis
The following other wikis use this file:
- Usage on en.wikipedia.org
- Usage on en.wikibooks.org