File:AtmosphericCounterradiation 100dpi en.png
Size of this preview: 593 × 600 pixels. Other resolutions: 237 × 240 pixels | 630 × 637 pixels.
Original file (630 × 637 pixels, file size: 20 KB, MIME type: image/png)
Captions
Captions
Add a one-line explanation of what this file represents
Summary
edit
| Description |
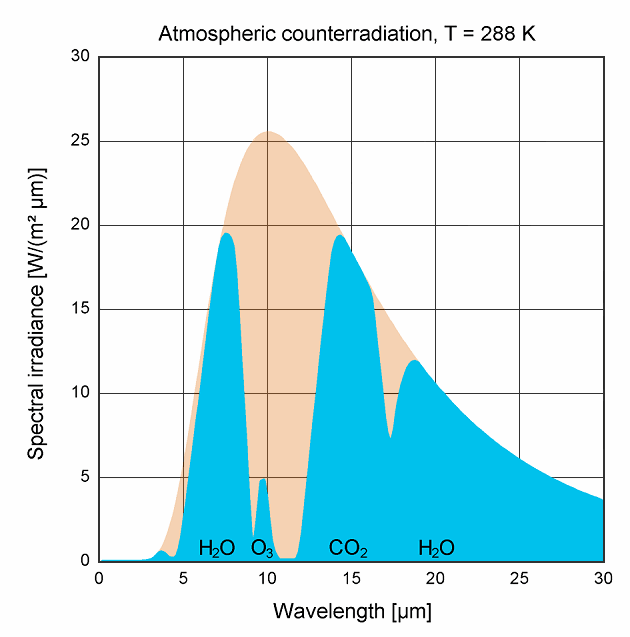
Description: Deutsch: Das schematische Diagramm zeigt das Spektrum der von der Atmosphäre abgegebenen Wärmestrahlung. Im Gegensatz zu einem Planckschen Spektrum (hellbraun zum Vergleich) besteht das Atmosphärenspektrum (blau) aus mehreren deutlich unterscheidbaren Spektralbanden, zwischen denen deutliche Lücken klaffen. Die Banden, hier als durchgehende Flächen dargestellt, bestehen in Wirklichkeit aus einer Unzahl aneinandergedrängter einzelner Spektrallinien. Die Strahlung wird von den Treibhausgasen in der Atmosphäre abgegeben, nicht von Sauerstoff und Stickstoff, welche infrarot-inaktiv sind. Die insgesamt abgegebene Strahlungsleistung ist geringer als die von einem Schwarzen Körper derselben Temperatur emittierte Leistung.
English: The schematic diagram shows the spectrum of the thermal radiation emitted by the atmosphere. Unlike a Planckian spectrum (shown in light brown for comparison) the atmospheric spectrum (blue) consists of several distinct spectral bands, with large gaps in between. The bands, shown solid here, actually consist of a large number of tightly packed single spectral lines. The radiation is emitted by the greenhouse gases in the atmosphere, not by oxygen and nitrogen which are inactive in the infrared. The total power radiated is less than that emitted by a black-body of the same temperature.
|
| Date | 7 March 2007 (original upload date) |
| Source | No machine-readable source provided. Own work assumed (based on copyright claims). |
| Author | No machine-readable author provided. Sch assumed (based on copyright claims). |
Licensing
edit
I, the copyright holder of this work, hereby publish it under the following license:

|
Permission is granted to copy, distribute and/or modify this document under the terms of the GNU Free Documentation License, Version 1.2 or any later version published by the Free Software Foundation; with no Invariant Sections, no Front-Cover Texts, and no Back-Cover Texts. A copy of the license is included in the section entitled GNU Free Documentation License. |
| This file is licensed under the Creative Commons Attribution-Share Alike 3.0 Unported license. | ||
| ||
| This licensing tag was added to this file as part of the GFDL licensing update. |
File history
Click on a date/time to view the file as it appeared at that time.
| Date/Time | Thumbnail | Dimensions | User | Comment | |
|---|---|---|---|---|---|
| current | 22:07, 7 March 2007 | | 630 × 637 (20 KB) | Sch (talk | contribs) | *Description: {{german}} Das schematische Diagramm zeigt das Spektrum der von der Atmosphäre abgegebenen Wärmestrahlung. Im Gegensatz zu einem Planckschen Spektrum (hellbraun zum Vergleich) besteht das Atmosphärenspektrum (blau) aus mehreren deutlich u |
You cannot overwrite this file.
File usage on Commons
The following page uses this file:
File usage on other wikis
The following other wikis use this file:
- Usage on de.wikipedia.org