File:Average Seasonal Temperature Range.png

Size of this preview: 800 × 400 pixels. Other resolutions: 320 × 160 pixels | 640 × 320 pixels | 1,024 × 512 pixels | 1,280 × 640 pixels | 2,560 × 1,280 pixels | 8,640 × 4,320 pixels.
Original file (8,640 × 4,320 pixels, file size: 4.37 MB, MIME type: image/png)
Captions
Captions
Add a one-line explanation of what this file represents
Summary edit
| Description |
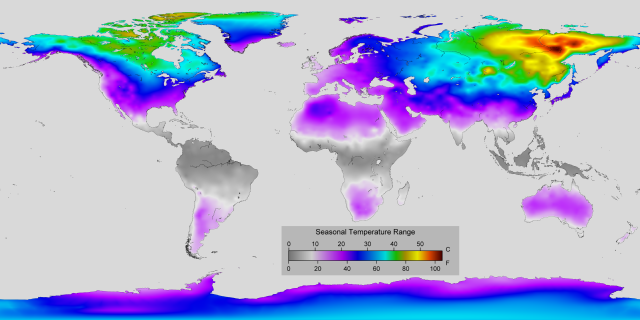
English: This map depicts the estimated average seasonal temperature range over land from 1951 to 1980. The seasonal temperature range is the difference between the average temperature in the warmest month and the average temperature in the coldest month. This map is based on the interpolation of ground level weather station data by Berkeley Earth. |
| Date | |
| Source | Image created by Robert A. Rohde for Berkeley Earth. Released under Creative Commons by Robert Rohde in his professional capacity as Lead Scientist for Berkeley Earth. |
| Author | Robert A. Rohde / Berkeley Earth |
Licensing edit
This file is licensed under the Creative Commons Attribution 4.0 International license.
- You are free:
- to share – to copy, distribute and transmit the work
- to remix – to adapt the work
- Under the following conditions:
- attribution – You must give appropriate credit, provide a link to the license, and indicate if changes were made. You may do so in any reasonable manner, but not in any way that suggests the licensor endorses you or your use.
File history
Click on a date/time to view the file as it appeared at that time.
| Date/Time | Thumbnail | Dimensions | User | Comment | |
|---|---|---|---|---|---|
| current | 10:43, 5 January 2016 | | 8,640 × 4,320 (4.37 MB) | Dragons flight (talk | contribs) | User created page with UploadWizard |
You cannot overwrite this file.
File usage on Commons
There are no pages that use this file.
File usage on other wikis
The following other wikis use this file:
- Usage on en.wikipedia.org