File:Bar vs line chart.png

Size of this preview: 800 × 297 pixels. Other resolutions: 320 × 119 pixels | 915 × 340 pixels.
Original file (915 × 340 pixels, file size: 40 KB, MIME type: image/png)
Captions
Captions
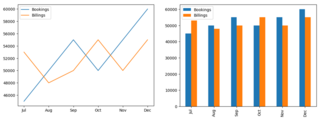
A line graph on the left and a bar graph on the right showing, line graphs are often the best means to present a quick overview of how two data sets vary in relation to one another than bar charts.
Summary
edit
| Description |
English: A line graph on the left and a bar graph on the right showing, line graphs are often the best means to present a quick overview of how two data sets vary in relation to one another than bar charts. |
| Date | |
| Source | Own work |
| Author | Amrutha.alur |
Licensing
edit
I, the copyright holder of this work, hereby publish it under the following license:
This file is licensed under the Creative Commons Attribution-Share Alike 4.0 International license.
- You are free:
- to share – to copy, distribute and transmit the work
- to remix – to adapt the work
- Under the following conditions:
- attribution – You must give appropriate credit, provide a link to the license, and indicate if changes were made. You may do so in any reasonable manner, but not in any way that suggests the licensor endorses you or your use.
- share alike – If you remix, transform, or build upon the material, you must distribute your contributions under the same or compatible license as the original.

|
This media file is uncategorized.
Please help improve this media file by adding it to one or more categories, so it may be associated with related media files (how?), and so that it can be more easily found.
Please notify the uploader with {{subst:Please link images|File:Bar vs line chart.png}} ~~~~ |
File history
Click on a date/time to view the file as it appeared at that time.
| Date/Time | Thumbnail | Dimensions | User | Comment | |
|---|---|---|---|---|---|
| current | 22:04, 26 April 2023 | 915 × 340 (40 KB) | Amrutha.alur (talk | contribs) | Uploaded own work with UploadWizard |
You cannot overwrite this file.
File usage on Commons
There are no pages that use this file.