File:Bevölkerungsprognosen Rathenow.pdf

Size of this JPG preview of this PDF file: 800 × 566 pixels. Other resolutions: 320 × 226 pixels | 640 × 453 pixels | 1,024 × 724 pixels | 1,280 × 905 pixels | 1,752 × 1,239 pixels.
Original file (1,752 × 1,239 pixels, file size: 68 KB, MIME type: application/pdf)
Captions
Captions
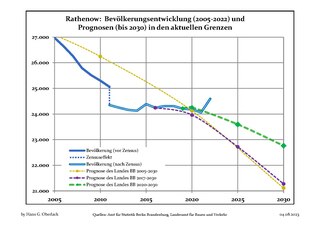
Recent population development (blue lines) and projections (dotted lines) of Rathenow, Havelland district, Brandenburg state, Germany
Summary edit
| Description |
Deutsch: Aktuelle Bevölkerungsentwicklung (blaue Linien) und Prognosen (punktierte Linien) für Rathenow , Landkreis Havelland, Land Brandenburg, Deutschland
English: Recent population development (blue lines) and projections (dotted lines) of Rathenow, Havelland district, Brandenburg state, Germany
Español: Tendencias actuales (lineas azules) y previsiones (lineas de puntos) de la poblacion de Rathenow, distrito de Havelland, estado de Brandenburg, Alemania
Français : Évolution actuelle de la population (lignes bleues) et projections démographiques (lignes pointillées) de Rathenow, arrondissement de Havelland, Land de Brandebourg, Allemagne
Italiano: Sviluppo recente della popolazione (linea blu) e previsioni demografiche (linea puntata) de Rathenow, circondario de Havelland, stato federato de Brandeburgo, Germania
Nederlands: Recente ontwikkeling van de bevolking (blauwe lijn) en prognoses (stippelijn) van Rathenow, landkreis Havelland, deelstaat Brandenburg, Duitsland
Polski: Obecne tendencje (niebieska linia) i prognozy demograficzne (linia przerywana) dla Rathenow, powiat Havelland, kraj Brandenburgia, Niemcy
Svenska: Aktuella befolkningsutveckling (blå linjen) och prognoser (prickade linjen) av Rathenow, landkreis Havelland, delstaten Brandenburg, Tyskland |
| Date | between 12 April 2012 and 4 August 2023 |
| Source | Own work based on: Data sources displayed at Population Projection Brandenburg at Wikimedia Commons |
| Author | Hans G. Oberlack |
| Latest population data | 2022 |
| Latest population forecast | LBV 2020-2030 |
| Object location | | View this and other nearby images on: OpenStreetMap |
|---|
Licensing edit
I, the copyright holder of this work, hereby publish it under the following license:
This file is licensed under the Creative Commons Attribution-Share Alike 3.0 Unported license.
- You are free:
- to share – to copy, distribute and transmit the work
- to remix – to adapt the work
- Under the following conditions:
- attribution – You must give appropriate credit, provide a link to the license, and indicate if changes were made. You may do so in any reasonable manner, but not in any way that suggests the licensor endorses you or your use.
- share alike – If you remix, transform, or build upon the material, you must distribute your contributions under the same or compatible license as the original.
File history
Click on a date/time to view the file as it appeared at that time.
| Date/Time | Thumbnail | Dimensions | User | Comment | |
|---|---|---|---|---|---|
| current | 17:20, 4 August 2023 |  | 1,752 × 1,239 (68 KB) | Hans G. Oberlack (talk | contribs) | 2022 data added |
| 12:18, 14 August 2022 |  | 1,752 × 1,239 (125 KB) | Hans G. Oberlack (talk | contribs) | 2021 data added | |
| 22:08, 11 August 2021 |  | 1,752 × 1,239 (125 KB) | Hans G. Oberlack (talk | contribs) | New official forecast and 2020 data added | |
| 21:46, 20 August 2020 | 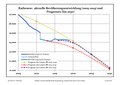 | 1,752 × 1,239 (124 KB) | Hans G. Oberlack (talk | contribs) | 2019 data added | |
| 21:38, 29 September 2019 |  | 1,752 × 1,239 (136 KB) | Hans G. Oberlack (talk | contribs) | 2018 data added | |
| 15:23, 9 February 2019 |  | 1,752 × 1,239 (124 KB) | Hans G. Oberlack (talk | contribs) | Latest official forecast added | |
| 11:27, 23 September 2018 |  | 1,752 × 1,239 (120 KB) | Hans G. Oberlack (talk | contribs) | 2017 data added | |
| 20:35, 7 February 2018 | 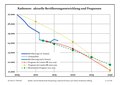 | 1,752 × 1,239 (118 KB) | Hans G. Oberlack (talk | contribs) | 2016 data added | |
| 00:01, 5 January 2017 | 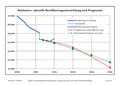 | 1,752 × 1,239 (116 KB) | Hans G. Oberlack (talk | contribs) | New official forecast and 2015 data added | |
| 14:43, 29 October 2014 | 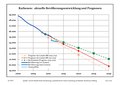 | 1,752 × 1,239 (97 KB) | Hans G. Oberlack (talk | contribs) | 2013 data added |
You cannot overwrite this file.
File usage on Commons
The following 4 pages use this file:
File usage on other wikis
The following other wikis use this file: