File:Brand Quality in 2010 by Average of Overall Reliability.png
Brand_Quality_in_2010_by_Average_of_Overall_Reliability.png (358 × 577 pixels, file size: 14 KB, MIME type: image/png)
Captions
Captions
Summary edit
| Description |
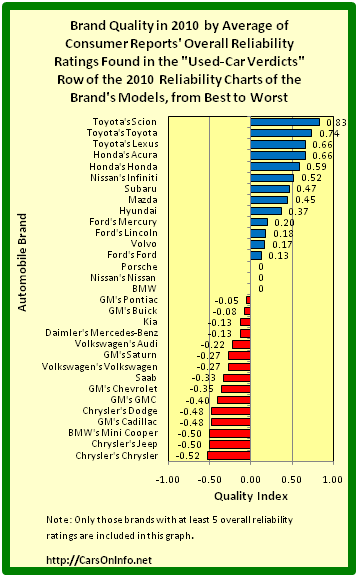
English: Car Brand Quality in 2010 by the Average of Overall Reliability Ratings
To compute brand quality ratings and assemble a brand quality ranking using Consumer Reports' overall reliability ratings, a number is associated with each rating. A +1.0 is ascribed to a rating of Much Better Than Average, a +0.5 to a rating of Better Than Average, a 0 to a rating of Average, a -0.5 to a rating of Worse Than Average, and a -1.0 to a rating of Much Worse Than Average. Then an average is taken over all of the brand's model years and models offering an overall reliability rating. CR's 2010 overall reliability ratings are found in the Used-Car-Verdicts row of its reliability charts. For this measure of quality, the range is from +1.0 (the best possible) to -1.0 (the worst possible). The quality ranking of the car brands by the foregoing computations, together with their quality ratings, is given in the bar graph above. Only those brands with at least 5 overall CR reliability ratings are included. Important Point: If the Toyota-engineered Pontiac Vibe is deleted from the Pontiac's reliability computations, the Pontiac brand would appear among the 10 worst brands, just below the Chevrolet brand. For a Google Knol that summarizes the changes in car brand and manufacturer ranking by this quality measure from 1990 to 2010, visit http://knol.google.com/k/james-bleeker/automobile-quality-by-car-brand-and/3o3u27f0whd6k/2?hd=ns# . |
| Date | |
| Source | James Benjamin Bleeker, Web Master of http://www.AutoOnInfo.net and http://CarsOnInfo.net |
| Author | James Benjamin Bleeker, Web Master of http://www.AutoOnInfo.net and http://CarsOnInfo.net |
Licensing edit
- You are free:
- to share – to copy, distribute and transmit the work
- to remix – to adapt the work
- Under the following conditions:
- attribution – You must give appropriate credit, provide a link to the license, and indicate if changes were made. You may do so in any reasonable manner, but not in any way that suggests the licensor endorses you or your use.
Original upload log edit
| Date/Time | Dimensions | User | Comment |
|---|---|---|---|
| 10 January 2011, 23:10:04 | 358 × 577 (19147 bytes) | JBleeker (talk · contribs) | {{Information |Description={{en|1=Brand Quality in 2010 by the Average of Overall Reliability Ratings: The Top 12 To compute brand quality ratings and assemble a brand quality ranking using Consumer Reports' overall reliability ratings, a number is assoc |
File history
Click on a date/time to view the file as it appeared at that time.
| Date/Time | Thumbnail | Dimensions | User | Comment | |
|---|---|---|---|---|---|
| current | 12:21, 25 August 2014 | | 358 × 577 (14 KB) | GifTagger (talk | contribs) | Bot: Converting file to superior PNG file. (Source: Brand_Quality_in_2010_by_Average_of_Overall_Reliability.gif). This GIF was problematic due to non-greyscale col... |
You cannot overwrite this file.
File usage on Commons
The following page uses this file:
- File:Brand Quality in 2010 by Average of Overall Reliability.gif (file redirect)