File:Brasil Inflacao 1950 1997.svg

Size of this PNG preview of this SVG file: 800 × 600 pixels. Other resolutions: 320 × 240 pixels | 640 × 480 pixels | 1,024 × 768 pixels | 1,280 × 960 pixels | 2,560 × 1,920 pixels.
Original file (SVG file, nominally 1,024 × 768 pixels, file size: 77 KB)
Captions
Captions
Add a one-line explanation of what this file represents
Summary
edit
| Description |
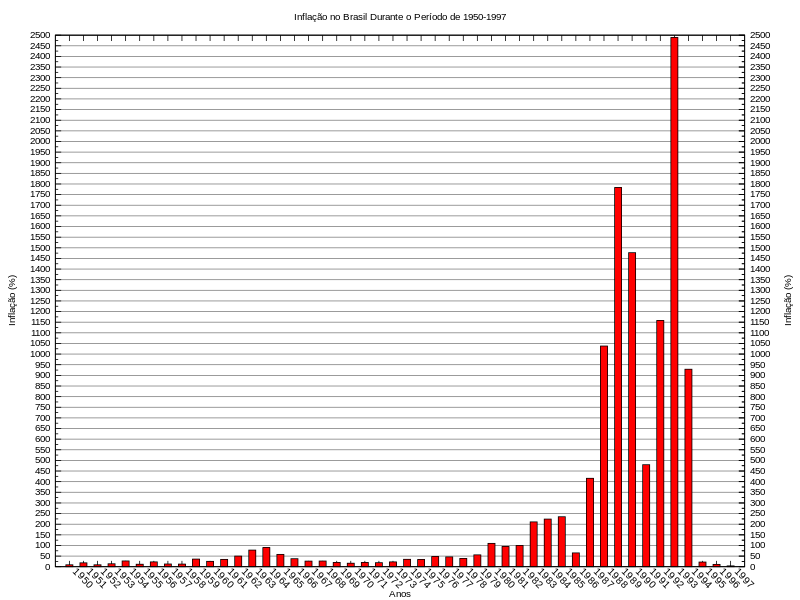
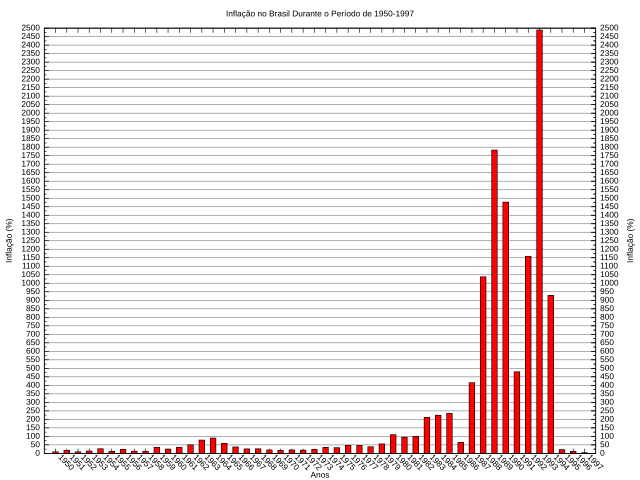
English: Brazilian inflation for the period of 1950-1997.
Português: Inflação do Brasil durante o período de 1950 até 1997. |
| Date | |
| Source | Own work |
| Author | MyNameIsBIFF |
Os dados foram retirados da seguinte página da Wikimedia Commons:
The data were taken from this Wikimedia Commons page:
File:Brasiliens_inflation_1950-1985.png
Os seguintes comandos foram utilizados para gerar o gráfico no gnuplot:
Gnuplot commands to generate the chart:

reset
set yrange  [0:2500]
set y2range [0:2500]
set xtics 1 rotate by -45
set ytics  50
set y2tics 50
set mytics  2
set my2tics 2
set xlabel  "Anos"
set ylabel  "Inflação (%)"
set y2label "Inflação (%)"
set style fill solid border -1
set style histogram rowstacked
set style data histograms
set boxwidth 0.50
set title "Inflação no Brasil Durante o Período de 1950-1997"
set grid y
unset key
plot "dataset" using 3:xtic(2) w histogram 1
Os dados utilizados:
Data used:

     1	1950	9.2	"9.2%"
     2	1951	18.4	"18.4%"
     3	1952	9.3	"9.3%"
     4	1953	13.8	"13.8%"
     5	1954	27.1	"27.1%"
     6	1955	11.8	"11.8%"
     7	1956	22.6	"22.6%"
     8	1957	12.7	"12.7%"
     9	1958	12.4	"12.4%"
    10	1959	35.9	"35.9%"
    11	1960	25.4	"25.4%"
    12	1961	34.7	"34.7%"
    13	1962	50.1	"50.1%"
    14	1963	78.4	"78.4%"
    15	1964	89.9	"89.9%"
    16	1965	58.2	"58.2%"
    17	1966	37.9	"37.9%"
    18	1967	26.5	"26.5%"
    19	1968	26.7	"26.7%"
    20	1969	20.1	"20.1%"
    21	1970	16.4	"16.4%"
    22	1971	20.3	"20.3%"
    23	1972	19.1	"19.1%"
    24	1973	22.7	"22.7%"
    25	1974	34.8	"34.8%"
    26	1975	33.9	"33.9%"
    27	1976	47.6	"47.6%"
    28	1977	46.2	"46.2%"
    29	1978	38.9	"38.9%"
    30	1979	55.8	"55.8%"
    31	1980	110.0	"110.0%"
    32	1981	95.0	"95.0%"
    33	1982	100.0	"100.0%"
    34	1983	211.0	"211.0%"
    35	1984	224.0	"224.0%"
    36	1985	235.0	"235.0%"
    37	1986	65.0	"65.0%"
    38	1987	416.0	"416.0%"
    39	1988	1038.0	"1038.0%"
    40	1989	1783.0	"1783.0%"
    41	1990	1477.0	"1477.0%"
    42	1991	480.0	"480.0%"
    43	1992	1158.0	"1158.0%"
    44	1993	2489.0	"2489.0%"
    45	1994	929.0	"929.0%"
    46	1995	22.0	"22.0%"
    47	1996	11.0	"11.0%"
    48	1997	4.0	"4.0%"
Licensing
edit
| I, the copyright holder of this work, release this work into the public domain. This applies worldwide. In some countries this may not be legally possible; if so: I grant anyone the right to use this work for any purpose, without any conditions, unless such conditions are required by law. |
File history
Click on a date/time to view the file as it appeared at that time.
| Date/Time | Thumbnail | Dimensions | User | Comment | |
|---|---|---|---|---|---|
| current | 02:48, 7 October 2010 | | 1,024 × 768 (77 KB) | MyNameIsBIFF (talk | contribs) | {{Information |Description={{en|1=Brazilian inflation for the period of 1950-1997.}} {{pt-br|1=Inflação do Brasil durante o período de 1950 até 1997.}} |Source={{own}} |Author=MyNameIsBIFF |Date=2010-10-05 |Permission= |other_ver |
You cannot overwrite this file.
File usage on Commons
There are no pages that use this file.
File usage on other wikis
The following other wikis use this file:
- Usage on pt.wikipedia.org