File:Buffer stock scheme (with ceiling & floor).svg

Size of this PNG preview of this SVG file: 780 × 500 pixels. Other resolutions: 320 × 205 pixels | 640 × 410 pixels | 1,024 × 656 pixels | 1,280 × 821 pixels | 2,560 × 1,641 pixels.
Original file (SVG file, nominally 780 × 500 pixels, file size: 16 KB)
Captions
Captions
Add a one-line explanation of what this file represents
| Description |
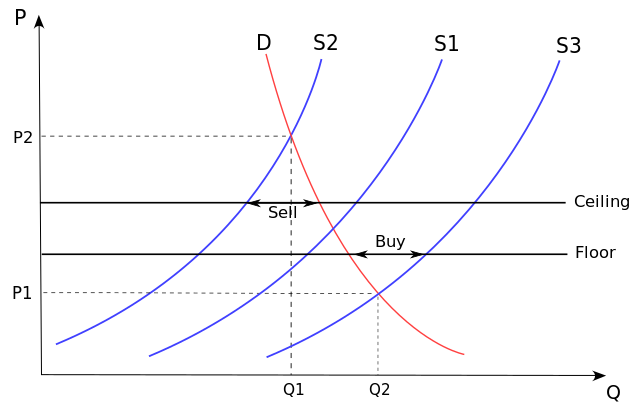
English: A diagram illustrating a simple buffer stock scheme. With no intervention, prices fluctuate between P1 and P2. To institute a ceiling (maximum price) and floor (minimum price), the government or other party buys when the price is low, making up demand, stores the commodity, and sells when the price is high. |
| Date | (UTC) |
| Source | |
| Author |
|
This file is licensed under the Creative Commons Attribution-Share Alike 3.0 Unported license.
- You are free:
- to share – to copy, distribute and transmit the work
- to remix – to adapt the work
- Under the following conditions:
- attribution – You must give appropriate credit, provide a link to the license, and indicate if changes were made. You may do so in any reasonable manner, but not in any way that suggests the licensor endorses you or your use.
- share alike – If you remix, transform, or build upon the material, you must distribute your contributions under the same or compatible license as the original.
Original upload log
edit.svg&action=edit§ion=1)
This image is a derivative work of the following images:
- File:Supply-and-demand.svg licensed with Cc-by-sa-2.5,2.0,1.0, Cc-by-sa-3.0-migrated, GFDL
- 2006-04-29T17:48:53Z Faxe 500x500 (13094 Bytes) [[Image:Supply-and-demand.svg|thumb]] == Opis == {{en|Supply and Demand}} * P - price * Q - quantity of good * S - supply * D - demand * author: Paweł Zdziarski (faxe) * created with [[:en:Inkscape]] {{pl|Popyt i podaż}
- 2006-04-29T17:38:06Z Faxe 500x500 (13096 Bytes) == Opis == {{en|Supply and Demand}} * author: Paweł Zdziarski (faxe) * created with [[:en:Inkscape]] {{pl|Popyt i podaż}} * autor: Paweł Zdziarski (faxe) * stworzone w [[:pl:Inkscape]] [[Category:Economics diagrams]]
- 2006-04-29T17:20:56Z Faxe 500x500 (9478 Bytes) {{en|Supply and Demand}} * author: Paweł Zdziarski (faxe) * created with [[:en:Inkscape]] {{pl|Popyt i podaż}} * autor: Paweł Zdziarski (faxe) * stworzone w [[:pl:Inkscape]] [[Category:Economics diagrams]]
Uploaded with derivativeFX
File history
Click on a date/time to view the file as it appeared at that time.
| Date/Time | Thumbnail | Dimensions | User | Comment | |
|---|---|---|---|---|---|
| current | 19:25, 23 April 2010 | | 780 × 500 (16 KB) | Jarry1250 (talk | contribs) | {{Information |Description={{en|A diagram illustrating a simple en:buffer stock scheme. With no intervention, prices fluctuate between P1 and P2. To institute a ceiling (maximum price) and floor (minimum price), the government or other party buys wh |
You cannot overwrite this file.
File usage on Commons
There are no pages that use this file.
File usage on other wikis
The following other wikis use this file:
- Usage on en.wikipedia.org
.svg&oldid=836793008)