File:CAPspendingbysector.png
No higher resolution available.
CAPspendingbysector.png (611 × 382 pixels, file size: 24 KB, MIME type: image/png)
Captions
Captions
Add a one-line explanation of what this file represents

|
File:CAPspendingbysector.svg is a vector version of this file. It should be used in place of this PNG file when not inferior.
File:CAPspendingbysector.png → File:CAPspendingbysector.svg
For more information, see Help:SVG. |
 |
Transferred from en.wikipedia to Commons by Maksim.
The original description page was here. All following user names refer to en.wikipedia.
Summary
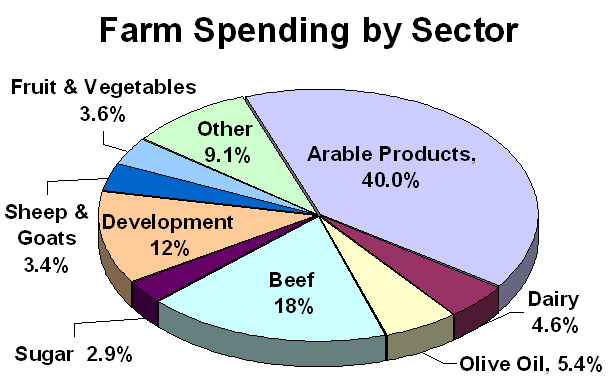
editPie chart showing percentages of CAP expenditure on different agricultural products. Created by me December 2005.
Licensing
edit| This work has been released into the public domain by its author, Sandpiper at English Wikipedia. This applies worldwide. In some countries this may not be legally possible; if so: Sandpiper grants anyone the right to use this work for any purpose, without any conditions, unless such conditions are required by law. |
| date/time | username | edit summary |
|---|---|---|
| 21:26, 19 December 2005 | en:User:Sandpiper | (Pie chart showing percentages of CAP expenditure on different agricultural products. Created by me December 2005.) |

Original upload log
edit
Legend: (cur) = this is the current file, (del) = delete this old version, (rev) = revert to this old version.
Click on date to download the file or see the image uploaded on that date.
- (del) (cur) 21:26, 19 December 2005 . . en:User:Sandpiper Sandpiper ( en:User_talk:Sandpiper Talk) . . 611x382 (24190 bytes) (Pie chart showing percentages of CAP expenditure on different agricultural products. Created by me December 2005.)
File history
Click on a date/time to view the file as it appeared at that time.
| Date/Time | Thumbnail | Dimensions | User | Comment | |
|---|---|---|---|---|---|
| current | 07:47, 1 April 2006 | | 611 × 382 (24 KB) | Maksim (talk | contribs) | La bildo estas kopiita de wikipedia:en. La originala priskribo estas: == Summary == Pie chart showing percentages of CAP expenditure on different agricultural products. Created by me December 2005. == Licensing == {{PD-self}} {| border="1" ! date/time | |
You cannot overwrite this file.
File usage on Commons
The following 2 pages use this file:
File usage on other wikis
The following other wikis use this file:
- Usage on ca.wikipedia.org
- Usage on en.wikipedia.org
- Usage on eo.wikipedia.org
- Usage on hy.wikipedia.org
- Usage on ia.wikipedia.org
- Usage on ja.wikipedia.org
- Usage on nl.wikipedia.org