File:CPC-NCEP-NOAA Blocking strength GHGS 6 Apr - 6 Jul 2015.png

No higher resolution available.
CPC-NCEP-NOAA_Blocking_strength_GHGS_6_Apr_-_6_Jul_2015.png (502 × 498 pixels, file size: 20 KB, MIME type: image/png)
Captions
Captions
Add a one-line explanation of what this file represents
Summary edit
| Description |
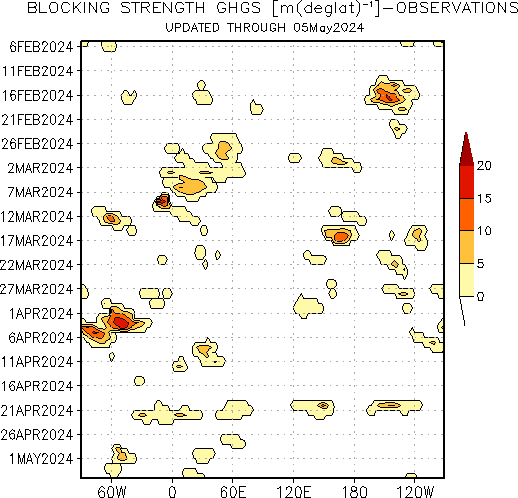
English: All colored regions in the hovmoller plot below depict regions where the flow is blocked according to the blocking index (Tibaldi and Molteni 1990). The color scheme denotes the strength of the blocked flow as determined from the 500 hPa geopotential height gradient measured from the blocking ridge equatorward (denoted GHGS in blocking index definition). The presence of an intense cutoff low equatorward of the blocking ridge can act to enhance the blocking strength. (Text after NOAA, Blocking),
Illustrates early 2015 blockings; heat waves in India, Pakistan, U.S. West coast and Europe, |
| Date | |
| Source | NOAA NCEP CPC > Climate & Weather Linkage > Blocking: 1panel_ghgs_obs_nh_nrm.gif |
| Author | NOAA / National Weather Service / National Centers for Environmental Prediction / Climate Prediction Center Internet Team |
| Other versions |
|

Licensing edit
| This file is in the public domain in the United States because it was solely created by NASA. NASA copyright policy states that "NASA material is not protected by copyright unless noted". (See Template:PD-USGov, NASA copyright policy page or JPL Image Use Policy.) | ||
 |
Warnings:
|
File history
Click on a date/time to view the file as it appeared at that time.
| Date/Time | Thumbnail | Dimensions | User | Comment | |
|---|---|---|---|---|---|
| current | 04:25, 14 July 2015 | | 502 × 498 (20 KB) | W!B: (talk | contribs) | =={{int:filedesc}}== {{Information |description={{en|1=All colored regions in the hovmoller plot below depict regions where the flow is blocked according to the blocking index (Tibaldi and Molteni 1990). The color scheme denotes the strength of the blo... |
You cannot overwrite this file.
File usage on Commons
The following page uses this file:
File usage on other wikis
The following other wikis use this file:
- Usage on de.wikipedia.org