File:Carolinas mrg 2018259.png
Carolinas_mrg_2018259.png (720 × 545 pixels, file size: 444 KB, MIME type: image/png)
Captions
Captions
Summary
edit
| Description |
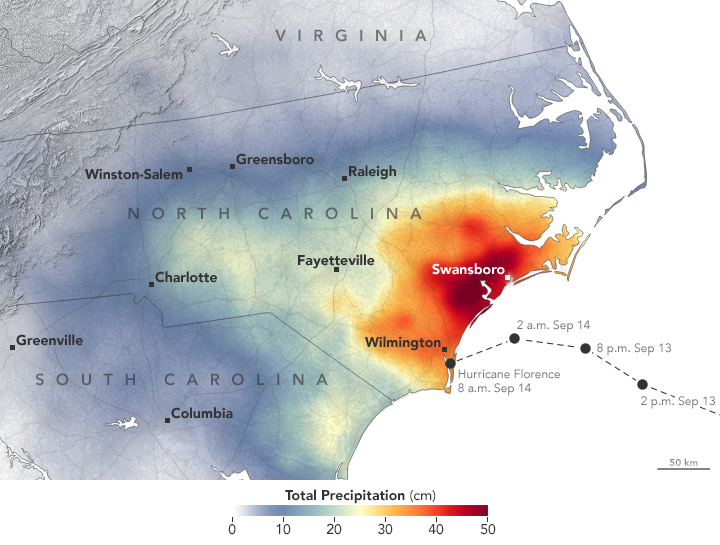
English: Upon making landfall on the southeastern U.S. coast on September 14, 2018, Hurricane Florence brought strong winds and torrential rains that flooded roads, houses, and rivers to historic levels and left hundreds of thousands of people without power. NASA data and researchers observed and analyzed the event, providing a steady stream of information to the Federal Emergency Management Agency (FEMA) and the National Guard to help assess the hurricane's impact.
Elizabethtown and Swansboro, North Carolina, received the highest recorded rainfall totals in the region—surpassing 33 inches (83 centimeters)— from September 13 to 18, according to the National Weather Service. Trent River, about 40 miles (60 kilometers) northwest of Swanson, swelled to levels exceeding previous records. At least 28 cities and towns in North Carolina received at least 20 inches of rain. Flooded roads isolated some areas such as Wilmington, where officials were planning to airlift food and water into the city. The image above shows the rain accumulation from September 13–16. These rainfall data are remotely-sensed estimates that come from the Integrated Multi-Satellite Retrievals (IMERG), a product of the Global Precipitation Measurement (GPM) mission. Local rainfall amounts can be significantly higher when measured from the ground. Heavier rainfall occurred on the right/north side of the hurricane track, similar to past hurricanes. As hurricanes in the northern hemisphere spin counterclockwise, winds on the right side tend to be stronger and can increase evaporation from the surface, particularly over the ocean. “But it's probably more important that the stream of air being pulled up the right side is coming from the tropics, which tend to have more moisture that feeds the precipitation,” said George Huffman, a research meteorologist at NASA’s Goddard Space Flight Center. “As you get close to landfall, the left side starts getting fed by air from the land, which is almost always drier.”Deutsch: Zum Landfall an der Küste der südöstlichen Bundesstaaten der Vereinigten Staaten am 14. September 2018 brachte Hurrikan Florence starken Wind und starkegen mit sich, der Straßen und Häuser überflutete, Flüsse historische Stände erreichen ließ und für hunderttausende von Bewohnern Stromausfälle verursachte. Daten der NASA sowie Beobachtungen und Analysen von Wissenschaftlern sorgten für einen Informationsstrom zur Federal Emergency Management Agency (FEMA) und der Nationalgarde, um bei der Bewertung der Auswirkungen durch den Hurrikan zu helfen.
Elizabethtown und Swansboro in North Carolina verzeichneten in der Zeit vom 13. bis 18. September die höchsten aufgezeichneten Niederschlagsmengen in der Region – nach den Angaben des National Weather Service mehr als 830 mm. Der Trent River schwoll etwa 60 Kilometer nordwestlich von Swanson in eine Höhe an, die die bisher aufgezeichneten Werte überstieg. In mindestens 28 Ortschaften in North Carolina fielen mehr als 500 mm Niederschlag. Überflutete Straßen schnitten einige Gebiete von der Außenwelt ab, darunter etwa Wilmington, wo die Behörden planten, Lebensmittel und Trinkwasser auf dem Luftweg in die Stadt zu bringen. Das Bild oben zeigt die Niederschlagssummen für die Zeit vom 13. bis 16. September 2018. Diese Regenmengen basieren auf Schätzungen mittels Integrated Multi-Satellite Retrievals (IMERG), einem Produkt der Global Precipitation Measurement (GPM) Mission. Die vor Ort tatsächlich aufgetretenen Regenmengen können deutlich davon abweichen. Die schwereren Regenfälle fanden auf der rechten/nördlichen Seite des Hurrikans statt. Da sich Wirbelstürme auf der Nordhalbkugel gegen den Uhrzeigersinn drehen, sind die Winde auf der rechten Seite des Sturms in der Regelstärker und können die Verdunstung vond der Wasseroberfläche verstärken. “Aber es ist wahrscheinlich wichtiger, daß der Luftstrom auf der rechten Seite aus dem Tropen gezogen wird, der dazu tendiert, feuchter zu sein, was die Niederschläge antreibt,” sagte George Huffman, ein Meteorologe im Goddard Space Flight Center der NASA. “Wenn man näher heran gelangt an den Landfall, dann beginnt die linke Seite luft vom Land zu ziehen, die fast immer trockener ist.” |
| Date | |
| Source | https://earthobservatory.nasa.gov/images/92775/florence-inundates-the-carolinas |
| Author | NASA Earth Observatory images by Joshua Stevens and Lauren Dauphin, using soil moisture data courtesy of JPL and the SMAP Science Team, IMERG data from the Global Precipitation Mission (GPM) at NASA/GSFC, and modified Copernicus Sentinel data (2018), processed by ESA and analyzed by the NASA-JPL/Caltech ARIA team. Story by Kasha Patel. |
| Other versions |
 Carolinas pre-Florence soil moisture |
References & Resources
edit
- Advanced Hydrologic Prediction Service Trent River at Trenton. Accessed September 18, 2018.
- CBS News (2018, September 18) Florence gone but its flooding a crisis in parts of North Carolina- live updates. Accessed September 18, 2018.
- Forbes (2017, September 17) Why The Right Side Of A Hurricane Is Particularly Dangerous. Accessed September 18, 2018.
- NASA Disasters Earth Science Program Hurricane Florence 2018. Accessed September 18, 2018.
- National Hurricane Center (2018) Florence Graphics Archive: Initial Wind Field and Watch/Warning Graphic. Accessed September 18, 2018.
- The Weather Prediction Center (2018, September 18) Storm Summary Number 19 for Heavy Rain and Wind Associated with Florence. Accessed September 18, 2018.
- The Weather Prediction Center (2018, September 18) Short Range Public Discussion. Accessed September 18, 2018.
Licensing
edit
| This file is in the public domain in the United States because it was solely created by NASA. NASA copyright policy states that "NASA material is not protected by copyright unless noted". (See Template:PD-USGov, NASA copyright policy page or JPL Image Use Policy.) | ||
 |
Warnings:
|
File history
Click on a date/time to view the file as it appeared at that time.
| Date/Time | Thumbnail | Dimensions | User | Comment | |
|---|---|---|---|---|---|
| current | 00:57, 18 October 2018 | | 720 × 545 (444 KB) | Matthiasb (talk | contribs) | {{Information |description ={{en|1=Upon making landfall on the southeastern U.S. coast on September 14, 2018, Hurricane Florence brought strong winds and torrential rains that flooded roads, houses, and rivers to historic levels and left hundreds of thousands of people without power. NASA data and researchers observed and analyzed the event, providing a steady stream of information to the Federal Emergency Management Agency (FEMA) and the National Guard to help as... |
You cannot overwrite this file.
File usage on Commons
The following page uses this file: