File:Chart to scalar vs. black sholes.jpg
No higher resolution available.
Chart_to_scalar_vs._black_sholes.jpg (616 × 230 pixels, file size: 20 KB, MIME type: image/jpeg)
Captions
Captions
Add a one-line explanation of what this file represents
Summary
edit
| Description |
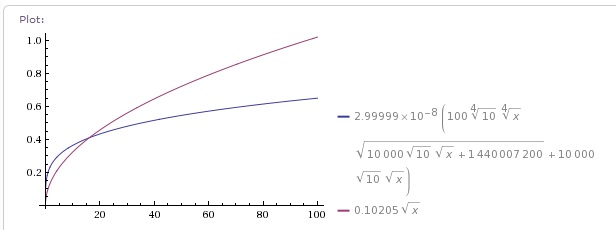
English: The magenta function is the call price of an option priced with Black Scholes. The blue is the option priced with Chart to Scalar. It may be optimal to buy options with an expiration before the intersection or in this example, t=16. |
| Date | |
| Source | Own work |
| Author | User4432 |
Licensing
edit
I, the copyright holder of this work, hereby publish it under the following license:
This file is licensed under the Creative Commons Attribution-Share Alike 3.0 Unported license.
- You are free:
- to share – to copy, distribute and transmit the work
- to remix – to adapt the work
- Under the following conditions:
- attribution – You must give appropriate credit, provide a link to the license, and indicate if changes were made. You may do so in any reasonable manner, but not in any way that suggests the licensor endorses you or your use.
- share alike – If you remix, transform, or build upon the material, you must distribute your contributions under the same or compatible license as the original.
File history
Click on a date/time to view the file as it appeared at that time.
| Date/Time | Thumbnail | Dimensions | User | Comment | |
|---|---|---|---|---|---|
| current | 21:45, 11 July 2013 | 616 × 230 (20 KB) | User4432 (talk | contribs) | User created page with UploadWizard |
You cannot overwrite this file.
File usage on Commons
There are no pages that use this file.