File:ClimateDashboard-global-sea-levels-graph-20230329-1400px.png
Size of this preview: 700 × 600 pixels. Other resolutions: 280 × 240 pixels | 560 × 480 pixels | 896 × 768 pixels | 1,195 × 1,024 pixels | 1,400 × 1,200 pixels.
Original file (1,400 × 1,200 pixels, file size: 88 KB, MIME type: image/png)
Captions
Captions
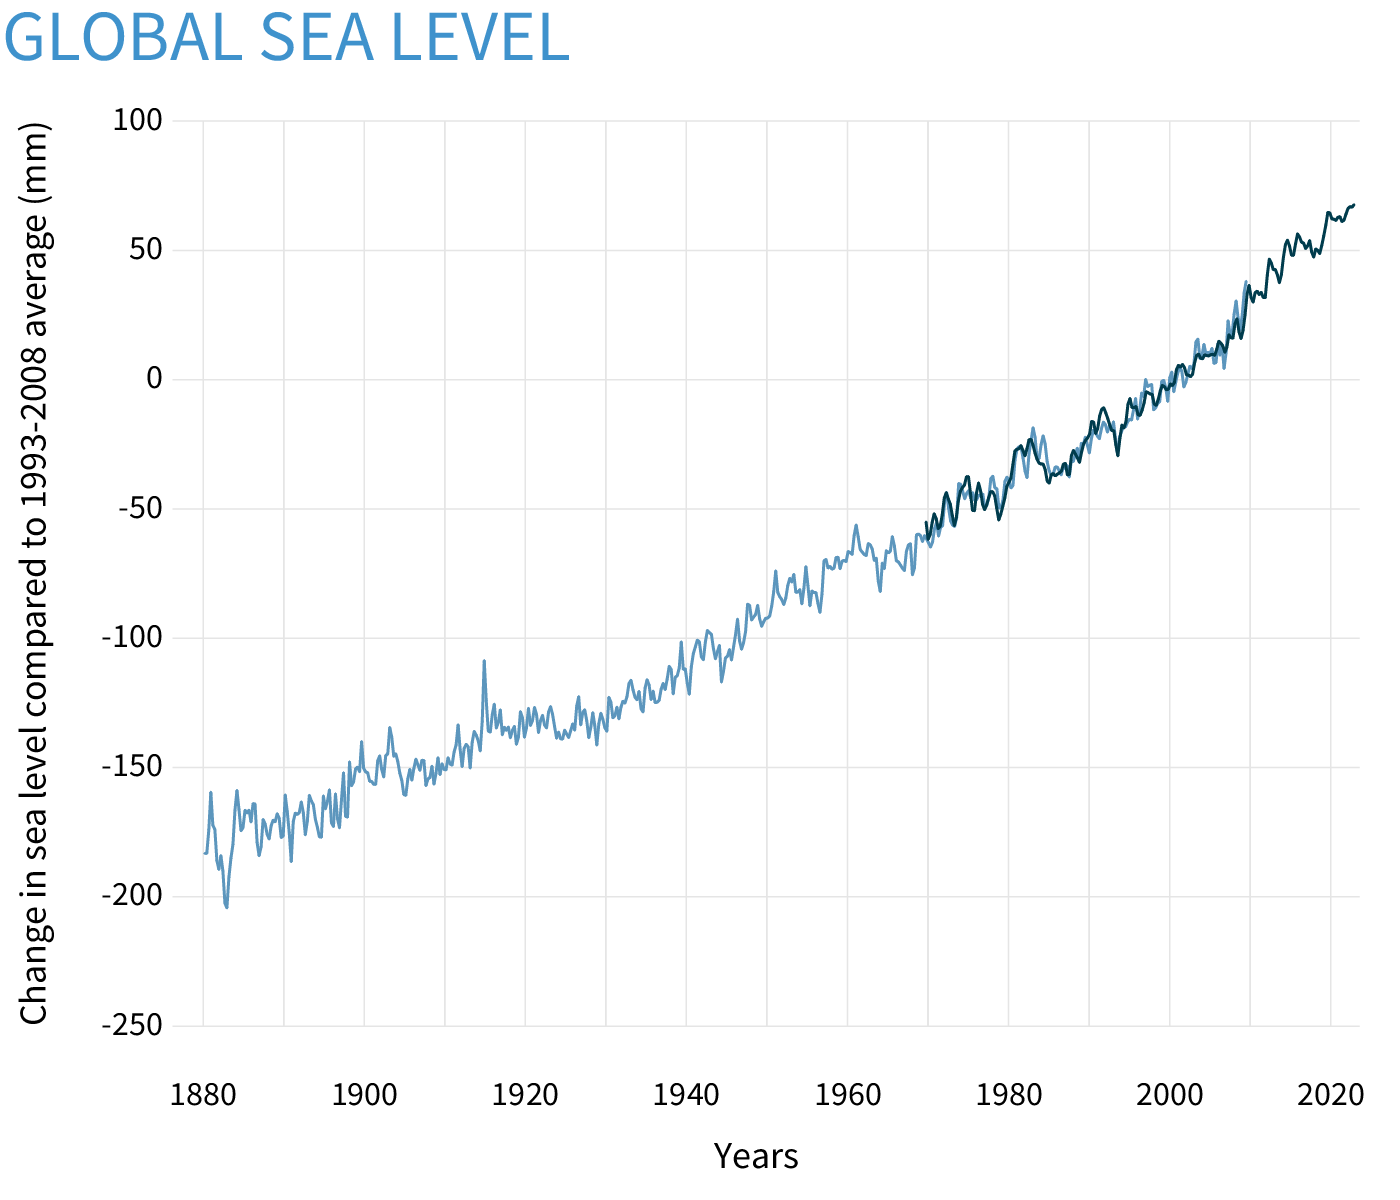
Global sea level rise estimates between 1880 and 2021
Summary edit
| Description |
English: Seasonal (3-month) sea level estimates from Church and White (2011) (light blue line) and University of Hawaii Fast Delivery sea level data (dark blue). The values are shown as change in sea level in millimeters compared to the 1993-2008 average. NOAA Climate.gov image based on analysis and data from Philip Thompson, University of Hawaii Sea Level Center.
Church, J. A., and White, N. J. (2011). Sea-Level Rise from the Late 19th to the Early 21st Century. Surveys in Geophysics, 32(4-5), 585–602. http://doi.org/10.1007/s10712-011-9119-1 |
| Date | |
| Source | https://www.climate.gov/news-features/understanding-climate/climate-change-global-sea-level |
| Author | NOAA |
Related file edit
-
 1880- Global average sea level rise (SLR) - annually.svg —
SVG from EPA data through 2021
_-_annually.svg)
Licensing edit
This image is in the public domain because it contains materials that originally came from the U.S. National Oceanic and Atmospheric Administration, taken or made as part of an employee's official duties.
|
File history
Click on a date/time to view the file as it appeared at that time.
| Date/Time | Thumbnail | Dimensions | User | Comment | |
|---|---|---|---|---|---|
| current | 17:12, 25 April 2023 | | 1,400 × 1,200 (88 KB) | Femke (talk | contribs) | Uploaded a work by NOAA from https://www.climate.gov/news-features/understanding-climate/climate-change-global-sea-level with UploadWizard |
You cannot overwrite this file.
File usage on Commons
The following page uses this file:
_-_annually.svg)
File usage on other wikis
The following other wikis use this file:
- Usage on en.wikipedia.org
- Usage on pt.wikipedia.org
- Usage on zh.wikipedia.org