File:Colored noise.png

Size of this preview: 482 × 600 pixels. Other resolutions: 193 × 240 pixels | 576 × 717 pixels.
Original file (576 × 717 pixels, file size: 64 KB, MIME type: image/png)
Captions
Captions
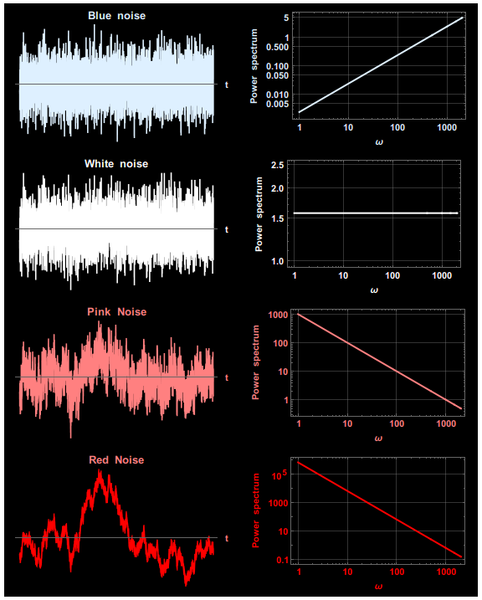
Example of noise signals with different power spectra.
Summary
edit| Description |
English: Example of noise signals with different power spectra. |
| Date | |
| Source | https://twitter.com/j_bertolotti/status/1151129795008200707 |
| Author | Jacopo Bertolotti |
| Permission (Reusing this file) |
https://twitter.com/j_bertolotti/status/1030470604418428929 |
| Other versions |
.png)
Mathematica 11.0 code
edit
n = 4096;
\[Phi] = RandomReal[{0, 2 \[Pi]}, n];
\[Epsilon][i_, \[Alpha]_] := Sum[Sqrt[k^-\[Alpha] Abs[(2 \[Pi])/n]^(1 - \[Alpha])]*Cos[(2 \[Pi] i k)/n + \[Phi][[k]]], {k, 1, n/2}];
red = Table[\[Epsilon][i, 2.], {i, 1, n}];
white = Table[\[Epsilon][i, 0.], {i, 1, n}];
pink = Table[\[Epsilon][i, 1.], {i, 1, n}];
blue = Table[\[Epsilon][i, -1.], {i, 1, n}];
GraphicsGrid[{{
ListPlot[blue, Joined -> True, PlotStyle -> LightBlue, LabelStyle -> {LightBlue, Bold}, AxesLabel -> {"t", ""}, Ticks -> None, Axes -> {True, False}, PlotLabel -> "Blue noise"],
ListLogLogPlot[Evaluate[(Abs[Fourier[blue]]^2)[[2 ;; n/2]]], Joined -> True, PlotRange -> All, PlotStyle -> {LightBlue, Thick}, Axes -> False, Frame -> True, FrameLabel -> {"\[Omega]", "Power spectrum"}, LabelStyle -> {LightBlue, Bold}, GridLines -> Automatic]
    }, {
ListPlot[white, Joined -> True, PlotStyle -> White, LabelStyle -> {White, Bold}, AxesLabel -> {"t", ""}, Ticks -> None, Axes -> {True, False}, PlotLabel -> "White noise"], ListLogLogPlot[Evaluate[(Abs[Fourier[white]]^2)[[2 ;; n/2]]], Joined -> True, PlotRange -> All, PlotStyle -> {White, Thick}, Axes -> False, Frame -> True, FrameLabel -> {"\[Omega]", "Power spectrum"},
LabelStyle -> {White, Bold}, GridLines -> Automatic]
    }, {
ListPlot[pink, Joined -> True, PlotStyle -> Pink, LabelStyle -> {Pink, Bold}, AxesLabel -> {"t", ""}, Ticks -> None, Axes -> {True, False}, PlotLabel -> "Pink Noise"], ListLogLogPlot[Evaluate[(Abs[Fourier[pink]]^2)[[2 ;; n/2]]], Joined -> True, PlotRange -> All, PlotStyle -> {Pink, Thick}, Axes -> False, Frame -> True, FrameLabel -> {"\[Omega]", "Power spectrum"},
LabelStyle -> {Pink, Bold}, GridLines -> Automatic]
    }, {
ListPlot[red, Joined -> True, PlotStyle -> Red, LabelStyle -> {Pink, Bold}, AxesLabel -> {"t", ""}, Ticks -> None, Axes -> {True, False}, PlotLabel -> "Red Noise"],
ListLogLogPlot[Evaluate[(Abs[Fourier[red]]^2)[[2 ;; n/2]]], Joined -> True, PlotRange -> All, PlotStyle -> {Red, Thick}, Axes -> False, Frame -> True, FrameLabel -> {"\[Omega]", "Power spectrum"},
    LabelStyle -> {Red, Bold}, GridLines -> Automatic]
    }}, ImageSize -> Large, Background -> Black]
Licensing
edit
I, the copyright holder of this work, hereby publish it under the following license:
| This file is made available under the Creative Commons CC0 1.0 Universal Public Domain Dedication. | |
| The person who associated a work with this deed has dedicated the work to the public domain by waiving all of their rights to the work worldwide under copyright law, including all related and neighboring rights, to the extent allowed by law. You can copy, modify, distribute and perform the work, even for commercial purposes, all without asking permission.
|
File history
Click on a date/time to view the file as it appeared at that time.
| Date/Time | Thumbnail | Dimensions | User | Comment | |
|---|---|---|---|---|---|
| current | 08:16, 17 July 2019 | | 576 × 717 (64 KB) | Berto (talk | contribs) | User created page with UploadWizard |
You cannot overwrite this file.
File usage on Commons
The following page uses this file: