File:Diag phase glace.png
Diag_phase_glace.png (337 × 347 pixels, file size: 2 KB, MIME type: image/png)
Captions
Captions

|
File:Diag phase glace.svg is a vector version of this file. It should be used in place of this PNG file when not inferior.
File:Diag phase glace.png → File:Diag phase glace.svg
For more information, see Help:SVG. |
 |
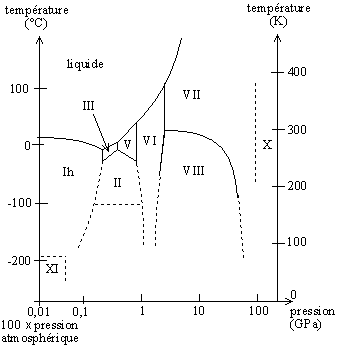
Diagramme de phase de la glace en fonction de la pression et de la température ; l'échelle des pressions est logarithmique.
- Avertissement : le diagramme de phase est repris d'une illustration largement utilisée (par exemple ici archive copy at the Wayback Machine), mais qui est elle-même erronée : on remarque que seule une graduation en degrés celsius est présente, et qu'elle est mal placée. Il faut donc prendre ce diagramme à titre indicatif
On peut voir d'autres formes de ce diagrammeici archive copy at the Wayback Machine, là, là archive copy at the Wayback Machine, encore ici archive copy at the Wayback Machine ou là, là[dead link] et là.
Ice phase diagram along the temperature and pressure changes; the scale of pressure is logarithmic.
- Warning: the phase diagram is inspired by a widely used illustration (e.g. ici archive copy at the Wayback Machine), but which is erroneous: only one tick is present for °C, and it does not correspond to the kelvin scale. This diagram is thus to be considered only as tendencies.
Other diagrams can be seen here :[1] archive copy at the Wayback Machine [2] [3] [4] archive copy at the Wayback Machine [5] [6][dead link] [7].
Auteur/author : Christophe Dang Ngoc Chan

|
Permission is granted to copy, distribute and/or modify this document under the terms of the GNU Free Documentation License, Version 1.2 or any later version published by the Free Software Foundation; with no Invariant Sections, no Front-Cover Texts, and no Back-Cover Texts. A copy of the license is included in the section entitled GNU Free Documentation License. |
| This file is licensed under the Creative Commons Attribution-Share Alike 3.0 Unported license. | ||
| ||
| This licensing tag was added to this file as part of the GFDL licensing update. |
derivative works
edit
Derivative works of this file: Diag phase glace.svg
File history
Click on a date/time to view the file as it appeared at that time.
| Date/Time | Thumbnail | Dimensions | User | Comment | |
|---|---|---|---|---|---|
| current | 21:29, 7 August 2005 | | 337 × 347 (2 KB) | Tornad (talk | contribs) | optim poids de l'image |
| 15:43, 21 March 2005 |  | 337 × 347 (3 KB) | Cdang (talk | contribs) | diagramme de phase de la glace - Ice phase diagram |
You cannot overwrite this file.
File usage on Commons
The following 5 pages use this file:
File usage on other wikis
The following other wikis use this file:
- Usage on eo.wikipedia.org
- Usage on fr.wikipedia.org
- Usage on fr.wiktionary.org
- Usage on gl.wikipedia.org
- Usage on ja.wikipedia.org
- Usage on oc.wikipedia.org
- Usage on pl.wikipedia.org