File:ETDRS Chart 1.svg

Size of this PNG preview of this SVG file: 631 × 599 pixels. Other resolutions: 253 × 240 pixels | 505 × 480 pixels | 809 × 768 pixels | 1,078 × 1,024 pixels | 2,156 × 2,048 pixels | 2,250 × 2,137 pixels.
Original file (SVG file, nominally 2,250 × 2,137 pixels, file size: 537 KB)
Captions
Captions
Add a one-line explanation of what this file represents
Summary
edit
.
| Description |
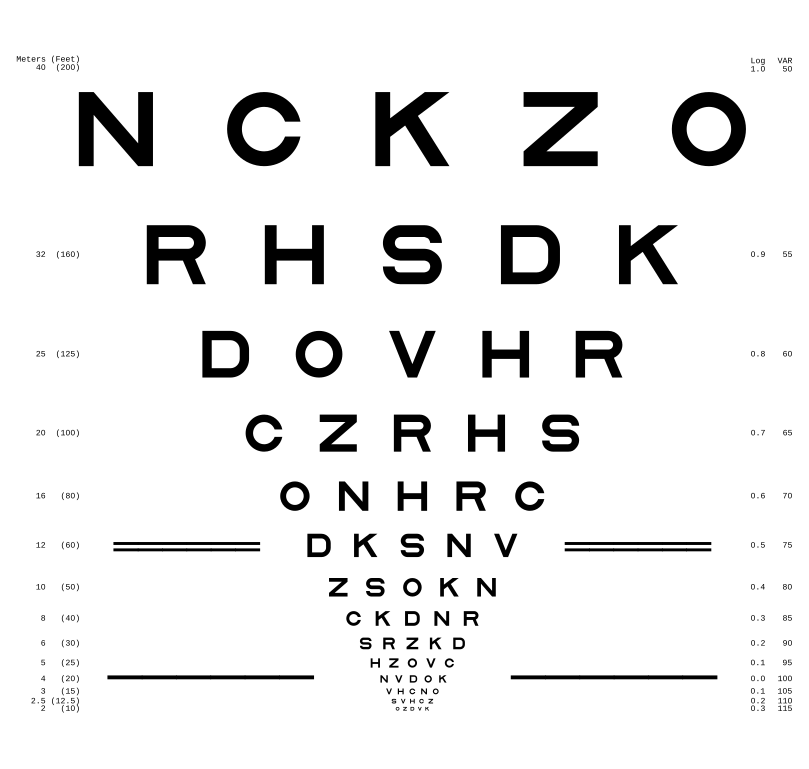
ETDRS Chart 1, one of the three logMAR chart models designed by Ferris, Kassoff, Bresnick, and Bailey for use in the Early Treatment Diabetic Retinopathy Study (ETDRS).
|
||
| Date | |||
| Source |
Own work, after
|
||
| Author | Fvasconcellos (talk · contribs) | ||
| Permission (Reusing this file) |
|
||
| Other versions | File:ETDRS Chart R.svg, File:ETDRS Chart 2.svg | ||
| SVG development | This vector image was created with Inkscape. |
File history
Click on a date/time to view the file as it appeared at that time.
| Date/Time | Thumbnail | Dimensions | User | Comment | |
|---|---|---|---|---|---|
| current | 23:33, 10 January 2021 | | 2,250 × 2,137 (537 KB) | Fvasconcellos (talk | contribs) | {{Information |Description=ETDRS Chart 1, one of the three {{w|logMAR chart}} models designed by Ferris, Kassoff, Bresnick, and Bailey for use in the Early Treatment Diabetic Retinopathy Study (ETDRS). *Chart and optotype dimensions in millimeters precisely as specified by Ferris et al. (1982). *LogMAR and VAR values after Baliey & Lovie (2013). *Note: meters/feet not a direct conversion, but rather in Snellen equivalents (1 meter = 5 feet). |Source=Own work, after *{{cite journal|authors=Fer... |
You cannot overwrite this file.
File usage on Commons
There are no pages that use this file.