File:Einwohnerentwicklung von Apolda.svg

Size of this PNG preview of this SVG file: 800 × 400 pixels. Other resolutions: 320 × 160 pixels | 640 × 320 pixels | 1,024 × 512 pixels | 1,280 × 640 pixels | 2,560 × 1,280 pixels.
Original file (SVG file, nominally 800 × 400 pixels, file size: 57 KB)
Captions
Captions
Add a one-line explanation of what this file represents
Summary edit
| Description |
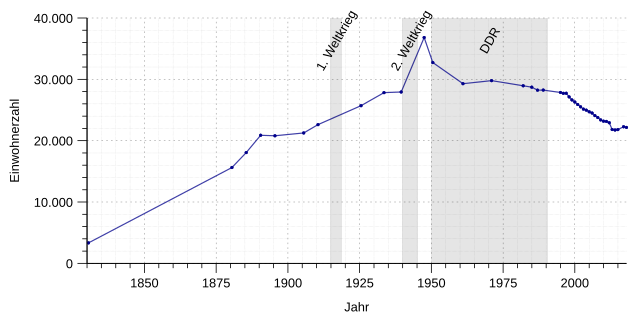
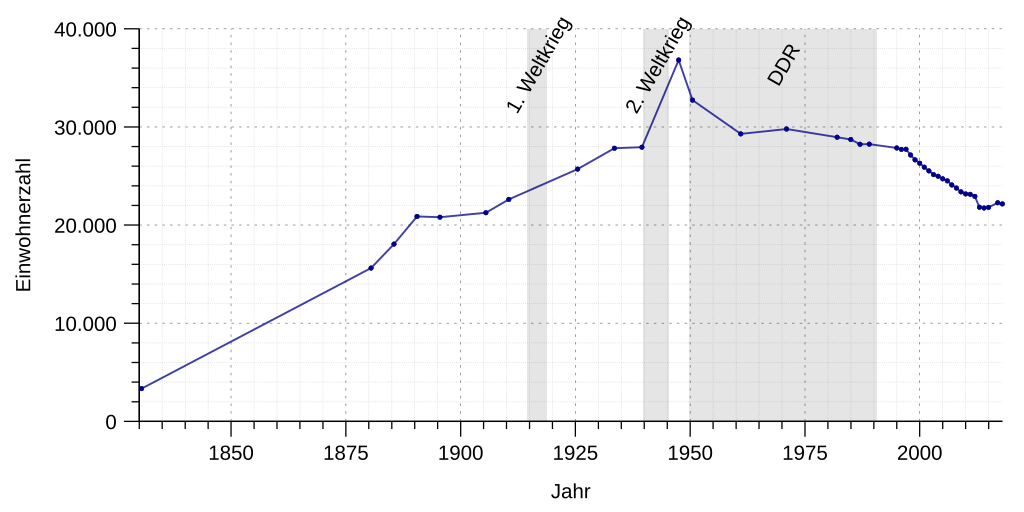
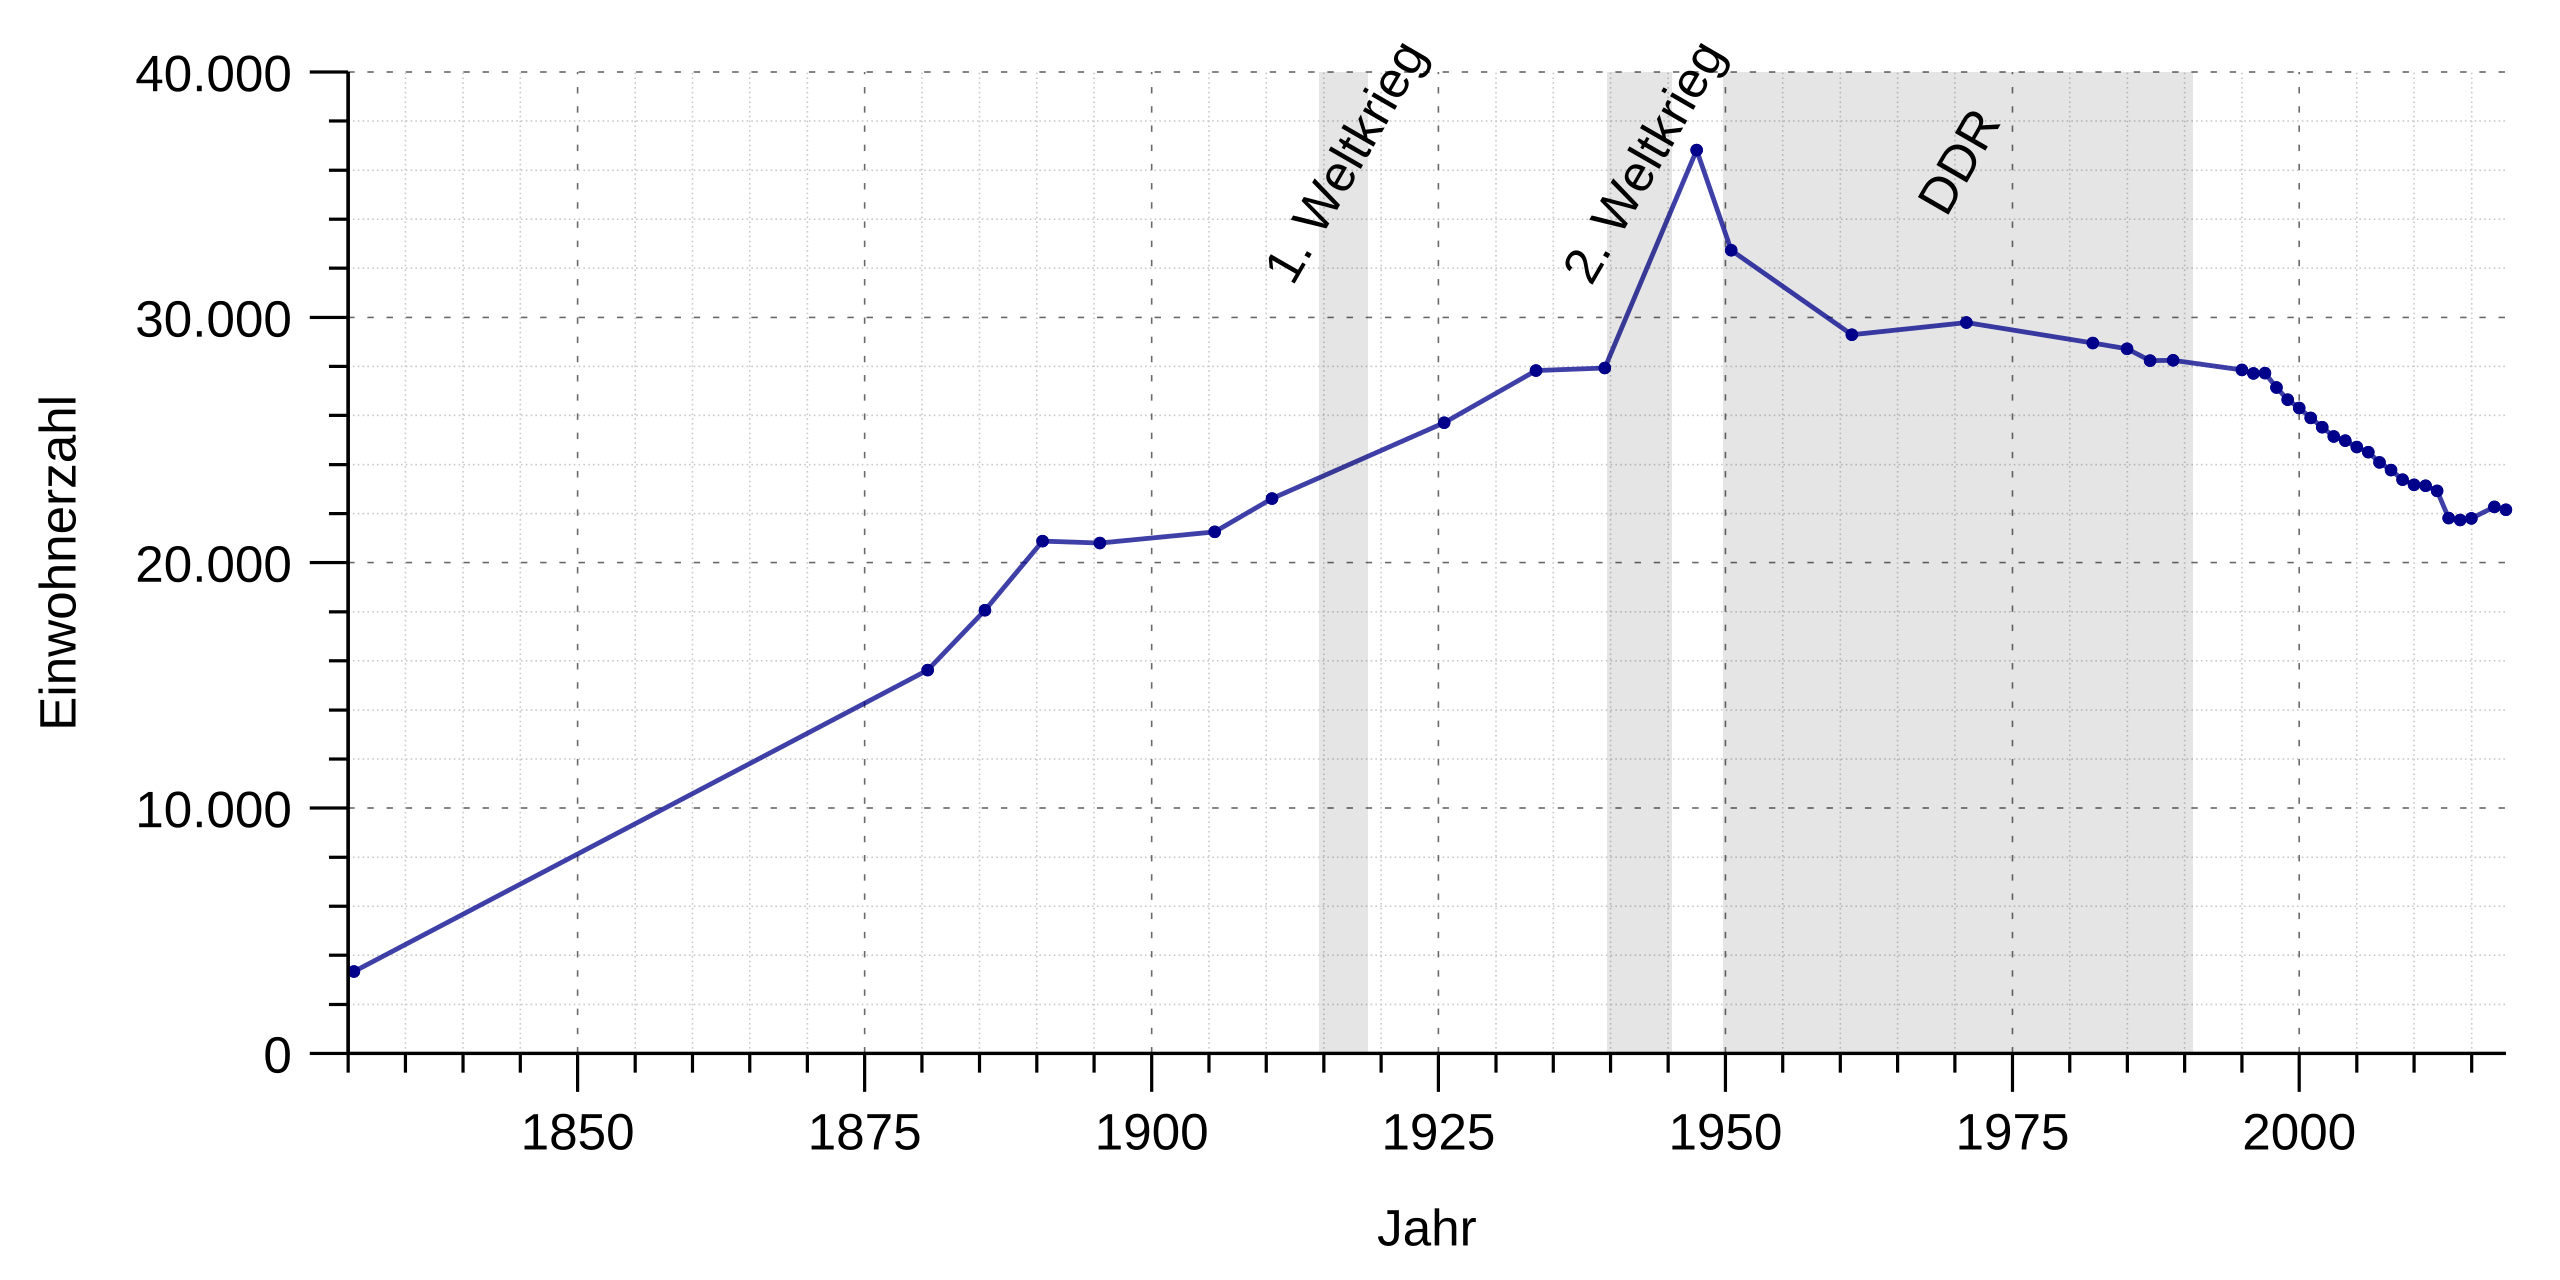
Deutsch: Einwohnerentwicklung von Apolda |
| Source | Own work |
| Author | Summer ... hier! (talk) 18:05, 14 January 2018 (UTC) |
Licensing edit
I, the copyright holder of this work, hereby publish it under the following license:
| This file is made available under the Creative Commons CC0 1.0 Universal Public Domain Dedication. | |
| The person who associated a work with this deed has dedicated the work to the public domain by waiving all of their rights to the work worldwide under copyright law, including all related and neighboring rights, to the extent allowed by law. You can copy, modify, distribute and perform the work, even for commercial purposes, all without asking permission.
|
Gnuplot script to generate this plot edit
W3C-validity not checked.
#!/usr/bin/gnuplot
# gnuplot


# Variablen - die wichtigsten Paramter dieser Grafik:
# (in der Regel wird es reichen für eine neue Grafik diese Werte zu ändern)
my_data               = 'Einwohnerentwicklung_von_Apolda.dat'
my_xrange_min         = '30.06.1830'
my_xrange_max         = '31.12.2022'
my_xtics_years        = '25'
my_mxtics             = '5'
my_yrange_min         = '0'
my_yrange_max         = '*'    # Nur hier ist '*' erlaubt und sinnvoll
my_ytics              = '5000'
my_ymtics             = '5'


# Allgemeines zu den Eingabedaten
set timefmt "%d.%m.%Y"     # Zeitangaben in TT.MM.YYYY
set datafile separator ";" # Spaltenseparator


# Allgemeines zur Ausgabe
unset key                  # als Standard keine Legende
set style data lines       # wird bei 'plot' überschrieben
set style fill transparent solid 0.4 # wird ebenfalls bei 'plot' überschrieben
set border 3               # Rahmen unten (Bit 1) und links (+ Bit 2)
set grid                   # Gitterlinien verwenden
# Gitterlinienen per Hand setzen falls gewünscht
set style line 1 linetype rgb '#696969' linewidth 0.5 dashtype 2 # Def. Major-grid
set style line 2 linetype rgb '#C9C9C9' linewidth 0.5 dashtype 3 # def. Minor-grid
set grid  xtics mxtics     # eventuell noxtics und nomxtics
set grid  ytics mytics     # eventuell noytics und nomytics
set grid  back             # Gitter im Hintergrund
set grid  linestyle 1, linestyle 2 # Setzen des linestyle für Major u. Minor
#show grid                  # Kontrollausgabe auf der Konsole


# Farben - nummerische Equavalente zu Namen nach:
# https://www2.uni-hamburg.de/Wiss/FB/15/Sustainability/schneider/gnuplot/colors.htm
# Die beiden Ziffen am Ende der Variablen geben  opacity/transparenz an
#
my_darkred_00       = '#008B0000'; my_darkred_20       = '#208B0000';
my_darkred_40       = '#408B0000'; my_darkred_60       = '#608B0000';
my_darkred_80       = '#808B0000'; my_darkred_a0       = '#a08B0000';
#
my_darkgreen_00     = '#00006400'; my_darkgreen_20     = '#20006400';
my_darkgreen_40     = '#40006400'; my_darkgreen_60     = '#60006400';
my_darkgreen_80     = '#80006400'; my_darkgreen_a0     = '#a0006400';
#
my_darkblue_00      = '#0000008B'; my_darkblue_20      = '#2000008B';
my_darkblue_40      = '#4000008B'; my_darkblue_60      = '#6000008B';
my_darkblue_80      = '#8000008B'; my_darkblue_a0      = '#a000008B';
#
my_darkmagenta_00   = '#008B008B'; my_darkmagenta_20   = '#208B008B';
my_darkmagenta_40   = '#408B008B'; my_darkmagenta_60   = '#608B008B';
my_darkmagenta_80   = '#808B008B'; my_darkmagenta_a0   = '#a08B008B';
#
my_darkorange_00    = '#00FF8C00'; my_darkorange_20    = '#20FF8C00';
my_darkorange_40    = '#40FF8C00'; my_darkorange_60    = '#60FF8C00';
my_darkorange_80    = '#80FF8C00'; my_darkorange_a0    = '#a0FF8C00';
#
my_darkturquoise_00 = '#0000CED1'; my_darkturquoise_20 = '#2000CED1';
my_darkturquoise_40 = '#4000CED1'; my_darkturquoise_60 = '#6000CED1';
my_darkturquoise_80 = '#8000CED1'; my_darkturquoise_a0 = '#a000CED1';


# Bereiche/Format/etc X-Achse
set xdata time             # X-Achse als Zeitachse
set xlabel 'Jahr'          # Beschriftung X-Achse
set xlabel offset 0, 0.75  # Schrift etwas höher
set xrange [ my_xrange_min : my_xrange_max]
                           # Wertebreich der X-Achse
set xtics '01.01.1000', 60 * 60 * 24 * 365.25 * my_xtics_years
                           # xtics in Sekunden
                           # der Beginn (Wert vor dem Komma) der X-Einteilung
                           # kann außerhalb xrange liegen
set xtics offset  0, 0.5   # Beschritung näher an die X-Achse
set mxtics 5               # Skalenstriche
set xtics nomirror         # Nur unten Skalieren
set format x '%Y'          # Beschriftungsformat JJJJ
set xtics  out             # Skal. aussen damit sie nicht von Grafik
                           # überschr. wird


# Bereiche/Format/etc Y-Achse
set ylabel 'Einwohnerzahl' offset 2 # Abstand Achse/Label
# Untere Begrenzung des Bereichs der Y-Achse
set yrange [ my_yrange_min : ]
# Obere  Begrenzung des Bereichs der Y-Achse
# wir Testen ob der Wert der Var.  my_yrange_max ein '*' ist und reagieren
# entsprechend weil der '*' sich nicht direkt via Var. setzen lässt.
if ( ( my_yrange_max eq '*' )) set yrange [ : *             ]
if (!( my_yrange_max eq '*' )) set yrange [ : my_yrange_max ]
set ytics my_ytics         # Anzahl der kleinen Teilstriche
set ytics offset 0.5       # Schrift etwas nach rechts
set ytics nomirror         # oben keine Teilstriche
set decimalsign locale "de_DE.utf8" # Stelle Input und Output auf "," um
                           # set decimalsign ',' würde nur Output umstellen,
set format y  "%'.0f"      # Ausgabeformat
set mytics my_ymtics       # Unterskalierung
set ytics  out             # Skal. aussen da sie sonst von Grafik
                           # überschr. wird


#### Markierungsbalken für die beiden Weltkriege etc.
# Die set-Befehle ggf. auskommentieren
# Attribute für Markierungsbalken
set style rect fillcolor lt -1 fillstyle solid 0.1 noborder
#
# == Dreißigjähriger Krieg
 set obj rect from '23.05.1618', graph 0 to '24.10.1648' , graph 1
 set label "Dreißigjähriger Krieg" at '30.06.1633', graph 0.8 rotate by +60 center
# == Siebenjähriger Krieg
#set obj rect from '29.08.1756', graph 0 to '21.09.1762' , graph 1
#set label "Siebenjähriger Krieg"  at '30.06.1759', graph 0.8 rotate by +60 center
# == Befreiungskriege
#set obj rect from '26.02.1813', graph 0 to '20.11.1815' , graph 1
#set label "Befreiungskriege"      at '30.06.1814', graph 0.8 rotate by +60 center
# == 1. Weltkrieg
 set obj rect from '28.07.1914', graph 0 to '11.11.1918' , graph 1
 set label "1. Weltkrieg"          at '30.06.1916', graph 0.4 rotate by +60 center
# == 2. Weltkrieg
 set obj rect from '01.09.1939', graph 0 to '04.05.1945' , graph 1
 set label "2. Weltkrieg"          at '30.06.1942', graph 0.4 rotate by +60 center
# == Dädärä
 set obj rect from '07.10.1949', graph 0 to '03.10.1990' , graph 1
 set label "DDR"                   at '01.01.1970', graph 0.4 rotate by +60 center


# Außenränder (ohne Angabe entspricht Automatik)
set bmargin
set lmargin
set rmargin 1.5 # rechts entspr. der Wert bei Auto etwas 2.8
set tmargin


# Ausgabeformat: Wir erzeugen SVG
# Die Ausgabedaten leiten wir bei UNIX in eine Pipe und sind so beim Namen der
# Ausgabedatei flexibel (Aufruf: Progname.plt > Ausgabe-svg)
# Windowsbenutzer, die mit Pipes nicht umgehen könnten, sollten hier hier das
# folgende 'set output ...' auskommentieren und den Dateinamen ggf. ersetzen.
# set output 'Einwohnerentwicklung_von_Apolda.svg'
set term svg size 800,400 font "Arial,16"
# Die Parameter von 'set term' sind so gewählt, das man in Wikipedia bei einer
# Einbindung [[Datei:Einwohnerentwicklung_von_Apolda.svg|mini|400px|Text]] noch Schrift/Details
# erkennen kann.


# Abkürzungen hinter dem Plot-Befehl:
#     u : using
#     w : with
#    lc : linecolor
#    lt : linetype
#    lw : linewidth
#    pt : pointtype
#    ps : pointsize
#    lp : linespoints
#     p : points
#     t : title
#   not : notitle


# Jede Kurve wird zweimal gezeichnet. Beim ersten mal mit etwas Transparenz
# damit es heller wird. Beim zweiten mal werden die Punkt dunkel
# nachgezeichnet. Dadurch sollte der Betrachter besser erkenen können, wo
# Messpunkte fehlen.
#
# Erzeugen der Ausgabe
plot \
  my_data u 1:2 w lp lc rgb my_darkblue_40 lt 1 lw 1.5 pt 7 ps 0.3   t 'Einw. Entw.',\
  my_data u 1:2 w  p lc rgb my_darkblue_00 lt 1 lw 1.5 pt 7 ps 0.3 not              ,\
Daten edit
Die folgenden Daten bitte in eine Textdatei unter dem Namen "Einwohnerentwicklung_von_Apolda.dat" abspeichern und ins gleiche Verzeichnis wie das GnuPlot-Script ablegen.
Update der Daten und Überschreiben der Grafik ausdrücklich erwünscht (bei Problemen beim Erstellen einer neuen Grafik unter de:Benutzer Diskussion:Summer ... hier! oder de:Wikipedia:Grafikwerkstatt nachfragen).
#
# Quelle:
# https://de.wikipedia.org/wiki/Apolda#Bev%C3%B6lkerungsentwicklung
#
30.06.1830 ;  3333
30.06.1880 ; 15630
30.06.1885 ; 18061
30.06.1890 ; 20880
30.06.1895 ; 20798
30.06.1905 ; 21262
30.06.1910 ; 22610
30.06.1925 ; 25703
30.06.1933 ; 27834
30.06.1939 ; 27936
30.06.1947 ; 36822
30.06.1950 ; 32736
31.12.1960 ; 29292
31.12.1970 ; 29784
31.12.1981 ; 28949
31.12.1984 ; 28725
31.12.1986 ; 28230
31.12.1988 ; 28244
31.12.1994 ; 27857
31.12.1995 ; 27720
31.12.1996 ; 27728
31.12.1997 ; 27135
31.12.1998 ; 26644
31.12.1999 ; 26301
31.12.2000 ; 25899
31.12.2001 ; 25526
31.12.2002 ; 25142
31.12.2003 ; 24971
31.12.2004 ; 24720
31.12.2005 ; 24500
31.12.2006 ; 24088
31.12.2007 ; 23774
31.12.2008 ; 23386
31.12.2009 ; 23179
31.12.2010 ; 23131
31.12.2011 ; 22925
31.12.2012 ; 21820
31.12.2013 ; 21738
31.12.2014 ; 21812
31.12.2016 ; 22279
31.12.2017 ; 22163
31.12.2018 ; 22012
31.12.2019 ; 22184
31.12.2020 ; 22209
31.12.2021 ; 22232
31.12.2022 ; 23072
EOF
File history
Click on a date/time to view the file as it appeared at that time.
| Date/Time | Thumbnail | Dimensions | User | Comment | |
|---|---|---|---|---|---|
| current | 23:32, 6 October 2018 | | 800 × 400 (57 KB) | Summer ... hier! (talk | contribs) | +Wert 2017 |
| 17:18, 7 March 2018 |  | 800 × 400 (70 KB) | Summer ... hier! (talk | contribs) | +Wert 2016 | |
| 18:05, 14 January 2018 |  | 800 × 400 (27 KB) | Summer ... hier! (talk | contribs) | {{Information |Description = {{de|Einwohnerentwicklung von Apolda}} |Source = {{own}} |Author = ~~~~ |Date = }} == {{int:license-header}} == {{self|Cc-zero}} == Gnuplot script to generate this plot == {{gnuplot}}{{ValidS... |
You cannot overwrite this file.
File usage on Commons
The following 2 pages use this file:
File usage on other wikis
The following other wikis use this file:
- Usage on de.wikipedia.org