File:Energy employment in fossil fuel and clean energy sectors.png
Size of this preview: 800 × 450 pixels. Other resolutions: 320 × 180 pixels | 640 × 360 pixels | 1,024 × 576 pixels | 1,280 × 720 pixels | 1,920 × 1,080 pixels.
Original file (1,920 × 1,080 pixels, file size: 64 KB, MIME type: image/png)
Captions
Captions
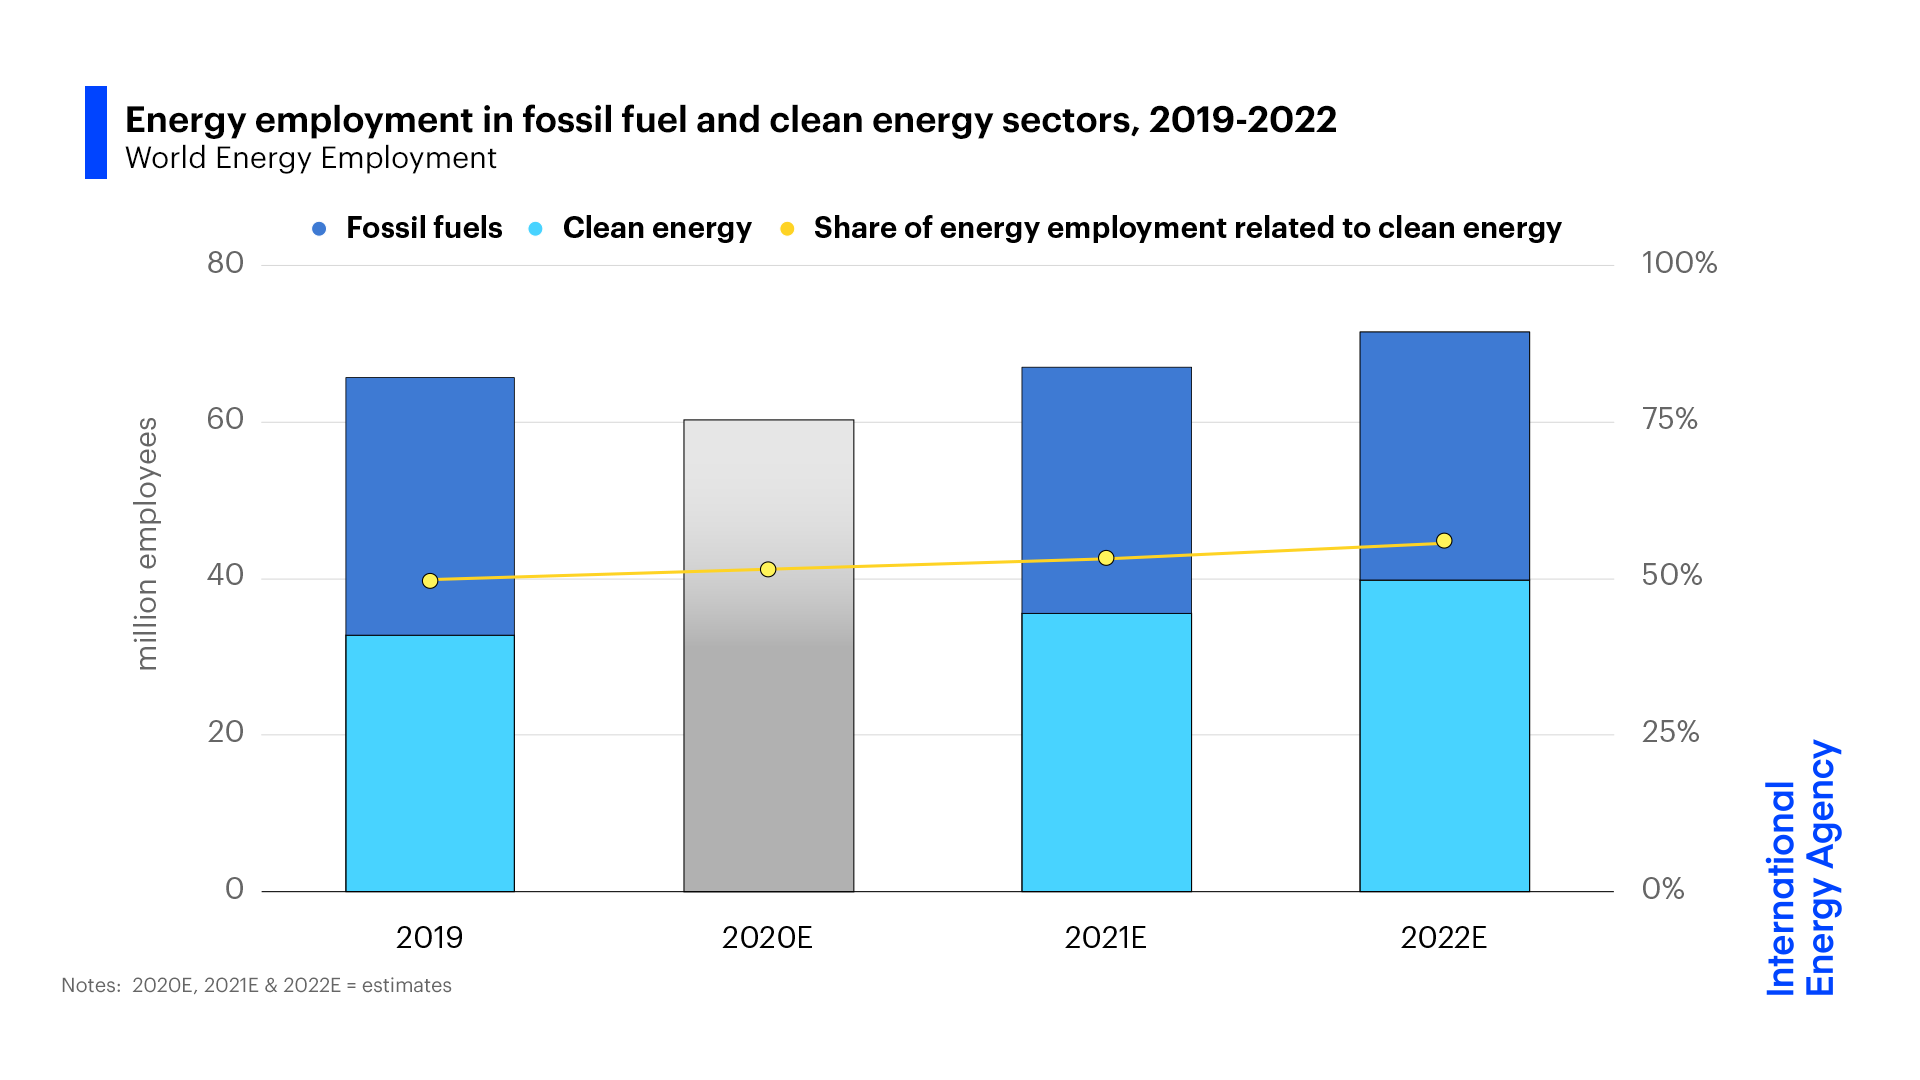
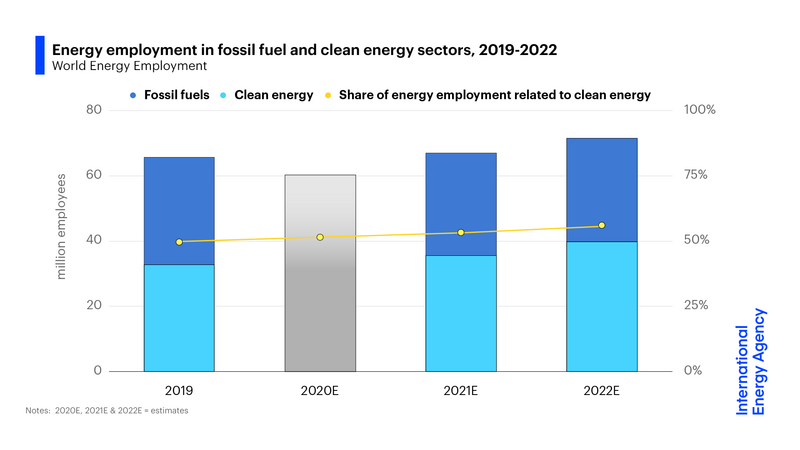
Energy employment in fossil fuel and clean energy sectors from 2019-2022
Summary
edit
| Description |
English: The graphic describes energy employment in fossil fuel and clean energy sectors, all figures used being estimates. It also demonstrates the share of energy employment related to clean energy for each year. This graphic was published as part of the World Energy Employment report. |
| Date | |
| Source | World Energy Employment |
| Author | International Energy Agency |
Licensing
edit
This file is licensed under the Creative Commons Attribution 4.0 International license.
- You are free:
- to share – to copy, distribute and transmit the work
- to remix – to adapt the work
- Under the following conditions:
- attribution – You must give appropriate credit, provide a link to the license, and indicate if changes were made. You may do so in any reasonable manner, but not in any way that suggests the licensor endorses you or your use.
File history
Click on a date/time to view the file as it appeared at that time.
| Date/Time | Thumbnail | Dimensions | User | Comment | |
|---|---|---|---|---|---|
| current | 09:46, 29 November 2022 | | 1,920 × 1,080 (64 KB) | EnergyAnalyst2 (talk | contribs) | Uploaded a work by International Energy Agency from World Energy Employment with UploadWizard |
You cannot overwrite this file.
File usage on Commons
The following page uses this file: