File:Food production per capita 1961-2005.png
No higher resolution available.
Food_production_per_capita_1961-2005.png (436 × 481 pixels, file size: 5 KB, MIME type: image/png)
Captions
Captions
Add a one-line explanation of what this file represents
Summary edit

|
File:Food production per capita.svg is a vector version of this file. It should be used in place of this PNG file when not inferior.
File:Food production per capita 1961-2005.png → File:Food production per capita.svg
For more information, see Help:SVG. |
 |
| Description |
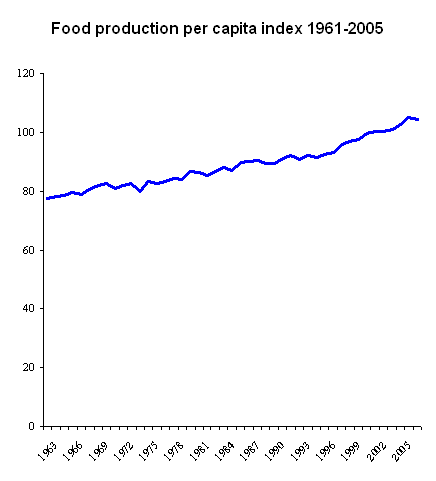
English: The y axis is percent of 1999-2001 average food production per capita
Data source: World Resources Institute. 2006. Available at http://earthtrends.wri.org. Washington DC: World Resources Institute. Meny "Agriculture and Food", submeny "Searchable Database". "Food and Agriculture Organization of the United Nations (FAO). 2006. FAOSTAT Online Statistical Service. Rome: FAO. Available online at: http://apps.fao.org" |
| Date | 3 September 2006 (original upload date) |
| Source | Transferred from en.wikipedia to Commons. |
| Author | Ultramarine at English Wikipedia |
Licensing edit
| This work has been released into the public domain by its author, Ultramarine at English Wikipedia. This applies worldwide. In some countries this may not be legally possible; if so: Ultramarine grants anyone the right to use this work for any purpose, without any conditions, unless such conditions are required by law. |
Original upload log edit
The original description page was here. All following user names refer to en.wikipedia.
- 2006-09-03 10:52 Ultramarine 436×481×8 (5459 bytes) == Summary == The y axis is percent of 1999-2001 average food production per capita Data source: World Resources Institute. 2006. Available at http://earthtrends.wri.org. Washington DC: World Resources Institute. "Food and Agriculture Organization of th
File history
Click on a date/time to view the file as it appeared at that time.
| Date/Time | Thumbnail | Dimensions | User | Comment | |
|---|---|---|---|---|---|
| current | 11:10, 7 May 2008 | | 436 × 481 (5 KB) | Renamed user ixgysjijel (talk | contribs) | {{Information |Description={{en|The y axis is percent of 1999-2001 average food production per capita Data source: World Resources Institute. 2006. Available at http://earthtrends.wri.org. Washington DC: World Resources Institute. Meny "Agriculture and F |
You cannot overwrite this file.
File usage on Commons
The following page uses this file:
File usage on other wikis
The following other wikis use this file:
- Usage on ca.wikipedia.org
- Usage on en.wikipedia.org
- Usage on es.wikipedia.org
- Usage on id.wikipedia.org
- Portal:Pertanian/Artikel pilihan/2014
- Portal:Pertanian/Artikel pilihan/Minggu 21 2014
- Portal:Pertanian/Artikel pilihan/2015
- Portal:Pertanian/Artikel pilihan/Minggu 9 2015
- Portal:Pertanian/Artikel pilihan/2016
- Portal:Pertanian/Artikel pilihan/Minggu 14 2016
- Portal:Pertanian/Artikel pilihan/2017
- Portal:Pertanian/Artikel pilihan/Minggu 5 2017