File:Frequency of occurrence of local temperature anomalies.jpg

Size of this preview: 800 × 400 pixels. Other resolutions: 320 × 160 pixels | 640 × 320 pixels | 1,024 × 513 pixels | 1,720 × 861 pixels.
Original file (1,720 × 861 pixels, file size: 817 KB, MIME type: image/jpeg)
Captions
Captions
Add a one-line explanation of what this file represents
Summary
edit| Description |
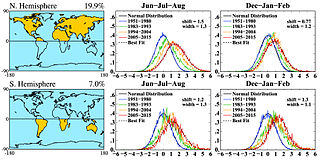
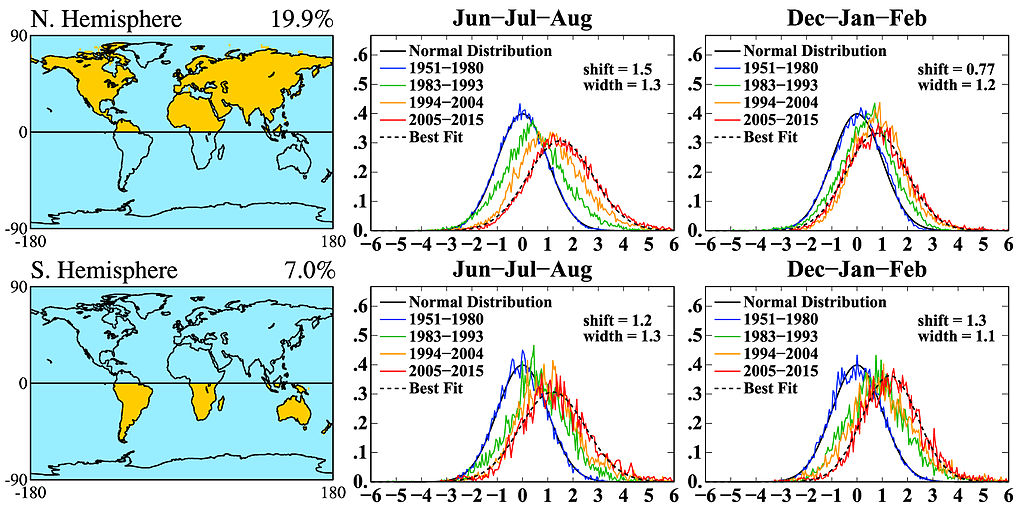
English: Frequency of occurrence of local temperature anomalies (relative to 1951–1980 mean) for the land areas highlighted on the small maps, divided by local standard deviation (horizontal axis). Area under each curve is unity. Numbers above the maps are percent of the globe covered by the selected region. 'Shift' and 'width' refer to the dashed curve fit to 2005–2015 data and are relative to the 1951–1980 base period.
Deutsch: Häufigkeitsverteilung lokaler Temperatur-Anomalien (in Bezug auf den Datenmittelwert vom Basiszeitraum von 1951 bis 1980) für die auf den kleinen Karten hervorgehobenen Landflächen, dividiert durch die lokale Standardabweichung (Abszisse). Die Fläche unter allen Kurven ist einheitlich. Die Zahlen über den Karten sind der prozentuale Anteil vom Globus, der von der jeweils gewählten Region bedeckt wird. "Shift" (Verschiebung) und "Width" (Weite) beziehen sich auf die gepunktet dargestellte Ausgleichskurve passend zu den Daten aus dem Zeitraum von 2005 bis 2015 im Vergleich zum Basiszeitraum von 1951 bis 1980. |
| Date | |
| Source | http://iopscience.iop.org/article/10.1088/1748-9326/11/3/034009 |
| Author | James E. Hansen |

Licensing
edit
This file is licensed under the Creative Commons Attribution 3.0 Unported license.
- You are free:
- to share – to copy, distribute and transmit the work
- to remix – to adapt the work
- Under the following conditions:
- attribution – You must give appropriate credit, provide a link to the license, and indicate if changes were made. You may do so in any reasonable manner, but not in any way that suggests the licensor endorses you or your use.
File history
Click on a date/time to view the file as it appeared at that time.
| Date/Time | Thumbnail | Dimensions | User | Comment | |
|---|---|---|---|---|---|
| current | 16:24, 29 March 2016 | | 1,720 × 861 (817 KB) | Hg6996 (talk | contribs) | {{Information |Description ={{en|1=Frequency of occurrence of local temperature anomalies (relative to 1951–1980 mean) divided by local standard deviation (horizontal axis) for land areas shown on map. Area under each curve is unity. Numbers above... |
You cannot overwrite this file.
File usage on Commons
There are no pages that use this file.
File usage on other wikis
The following other wikis use this file:
- Usage on de.wikipedia.org
- Usage on nl.wikipedia.org