File:Frequency rate chart example.jpg

Size of this preview: 800 × 461 pixels. Other resolutions: 320 × 184 pixels | 640 × 368 pixels | 1,070 × 616 pixels.
Original file (1,070 × 616 pixels, file size: 62 KB, MIME type: image/jpeg)
Captions
Captions
Add a one-line explanation of what this file represents
Summary edit
| Description |
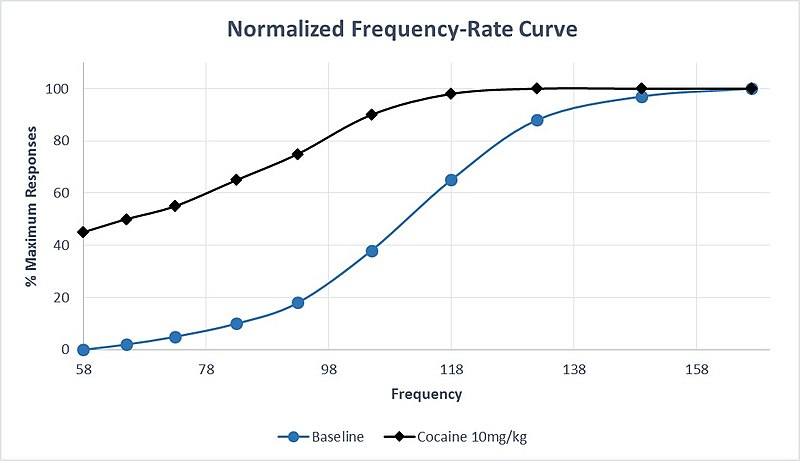
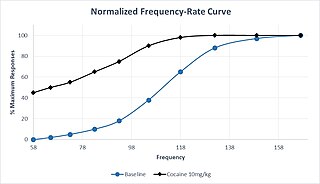
English: Example frequency-rate plot for 10 trials over increasing stimulation frequencies. Hypothetical data (which reflects established concepts in ICSS procedures) is plotted as the percent maximum responses for any given trial during a sequence. The blue line represents hypothetical data at baseline, while the black line represents hypothetical data following administration of 10 mg/kg cocaine to the subject. This reflects the characteristic "left-shift" of the frequency-rate curve following administration of a drug which increases dopaminergic transmission in the reward pathway. |
| Date | |
| Source | Own work |
| Author | Kristynb4 |
Licensing edit
I, the copyright holder of this work, hereby publish it under the following license:
This file is licensed under the Creative Commons Attribution-Share Alike 4.0 International license.
- You are free:
- to share – to copy, distribute and transmit the work
- to remix – to adapt the work
- Under the following conditions:
- attribution – You must give appropriate credit, provide a link to the license, and indicate if changes were made. You may do so in any reasonable manner, but not in any way that suggests the licensor endorses you or your use.
- share alike – If you remix, transform, or build upon the material, you must distribute your contributions under the same or compatible license as the original.
File history
Click on a date/time to view the file as it appeared at that time.
| Date/Time | Thumbnail | Dimensions | User | Comment | |
|---|---|---|---|---|---|
| current | 15:58, 12 December 2017 | | 1,070 × 616 (62 KB) | Kristynb4 (talk | contribs) | User created page with UploadWizard |
You cannot overwrite this file.
File usage on Commons
There are no pages that use this file.
File usage on other wikis
The following other wikis use this file:
- Usage on en.wikipedia.org