File:Gillian 1970 track.png
Size of this preview: 800 × 495 pixels. Other resolutions: 320 × 198 pixels | 640 × 396 pixels | 1,024 × 633 pixels | 1,280 × 791 pixels | 2,700 × 1,669 pixels.
Original file (2,700 × 1,669 pixels, file size: 152 KB, MIME type: image/png)
Captions
Captions
Add a one-line explanation of what this file represents
Summary
edit| Description |
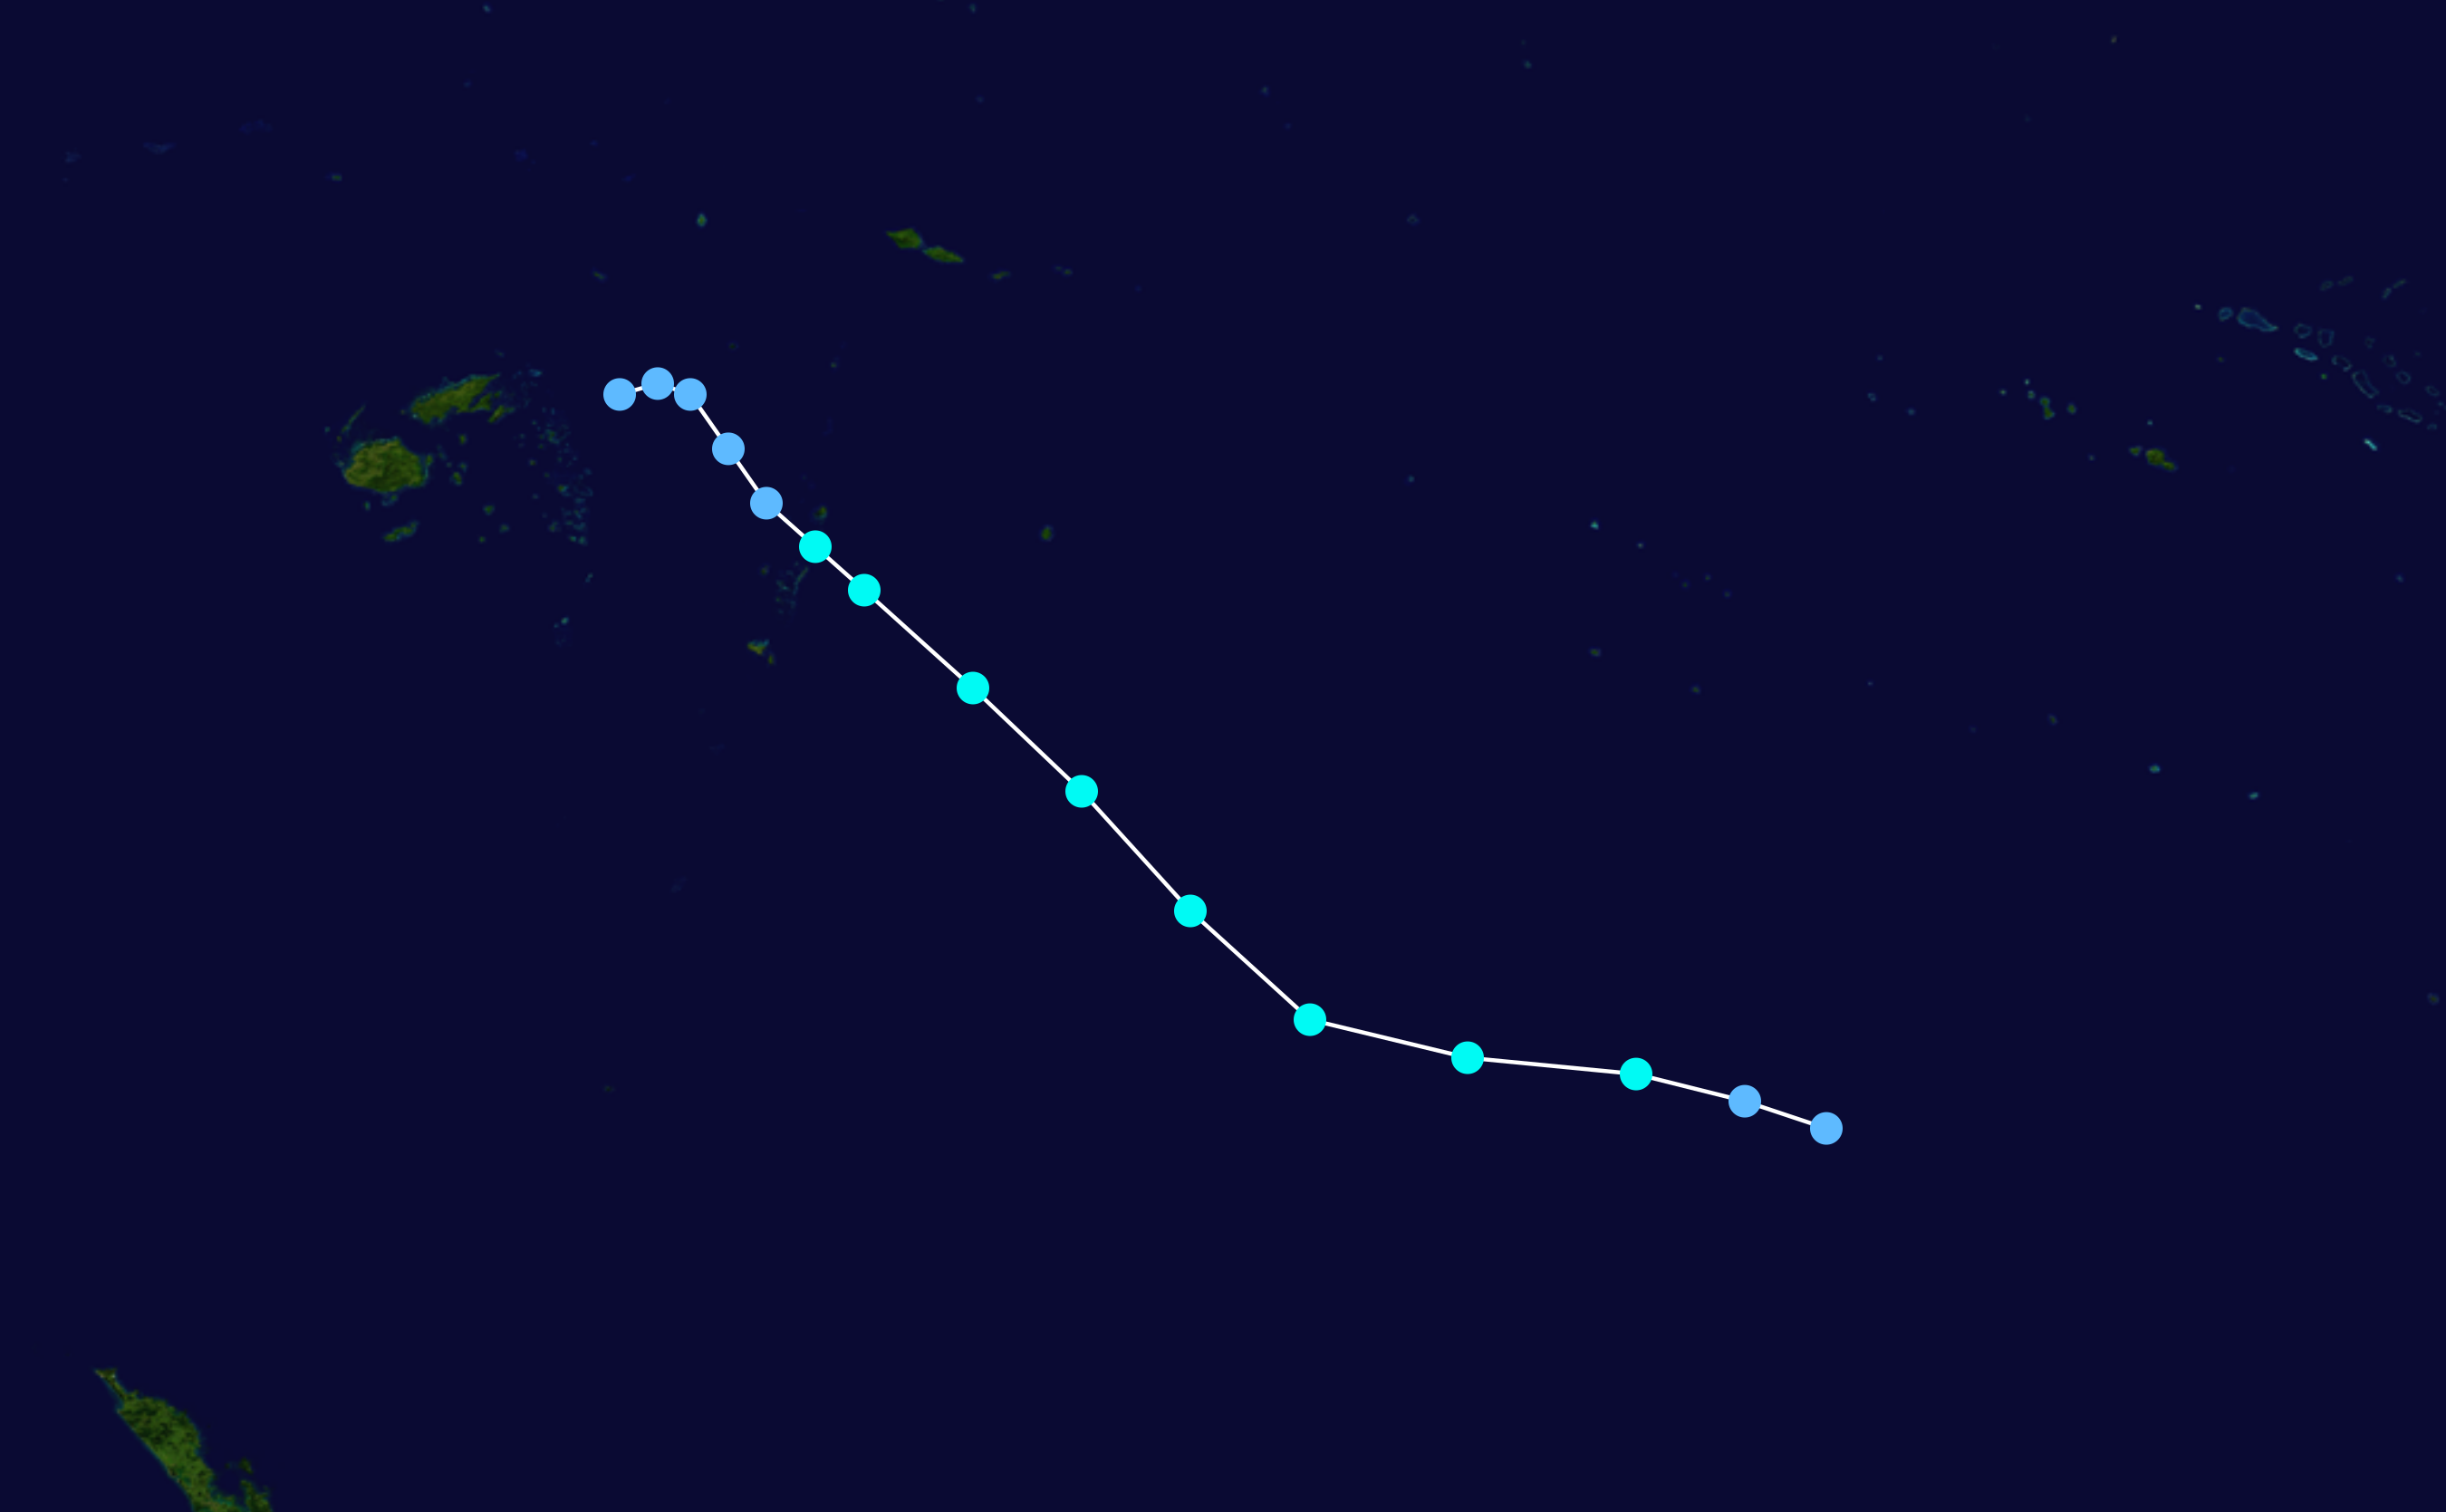
English: Cyclone Gillian (1970) track. Uses the color scheme from the Saffir-Simpson Hurricane Scale. The points show the location of each storm at six-hour intervals. The colour represents the storm's maximum sustained wind speeds as classified in the Saffir-Simpson Hurricane Scale (see below), and the shape of the data points represent the nature of the storm.
Tropical depression (≤38 mph, ≤62 km/h)
Tropical storm (39–73 mph, 63–118 km/h)
Category 1 (74–95 mph, 119–153 km/h)
Category 2 (96–110 mph, 154–177 km/h)
Category 3 (111–129 mph, 178–208 km/h)
Category 4 (130–156 mph, 209–251 km/h)
Category 5 (≥157 mph, ≥252 km/h)
Unknown
Storm type |
| Date | – |
| Source | Created using Wikipedia:WikiProject Tropical cyclones/Tracks. The background image was created by NASA. The tracking data is from the Joint Typhoon Warning Center's best track database |
| Author | Cyclonebiskit |
| This work has been released into the public domain by its author, Cyclonebiskit. This applies worldwide. In some countries this may not be legally possible; if so: Cyclonebiskit grants anyone the right to use this work for any purpose, without any conditions, unless such conditions are required by law. |
File history
Click on a date/time to view the file as it appeared at that time.
| Date/Time | Thumbnail | Dimensions | User | Comment | |
|---|---|---|---|---|---|
| current | 23:15, 23 May 2019 | | 2,700 × 1,669 (152 KB) | FleurDeOdile (talk | contribs) | neumann track |
| 22:04, 4 July 2009 |  | 1,024 × 633 (40 KB) | Cyclonebiskit (talk | contribs) | ==Summary== {{Information |Description={{en|Track map of Tropical Cyclone Gillian of the 1969-70 South Pacific cyclone season. The points show the location of the storm at 6-hour intervals. The colour represents the storm's [[:w:maximum sustained wind|max |
You cannot overwrite this file.
File usage on Commons
There are no pages that use this file.
File usage on other wikis
The following other wikis use this file:
- Usage on en.wikipedia.org