File:Global Temperature Anomaly-es.svg

Size of this PNG preview of this SVG file: 708 × 599 pixels. Other resolutions: 284 × 240 pixels | 567 × 480 pixels | 907 × 768 pixels | 1,210 × 1,024 pixels | 2,420 × 2,048 pixels | 951 × 805 pixels.
Original file (SVG file, nominally 951 × 805 pixels, file size: 32 KB)
Captions
Captions
Add a one-line explanation of what this file represents
Summary
edit
| Description |
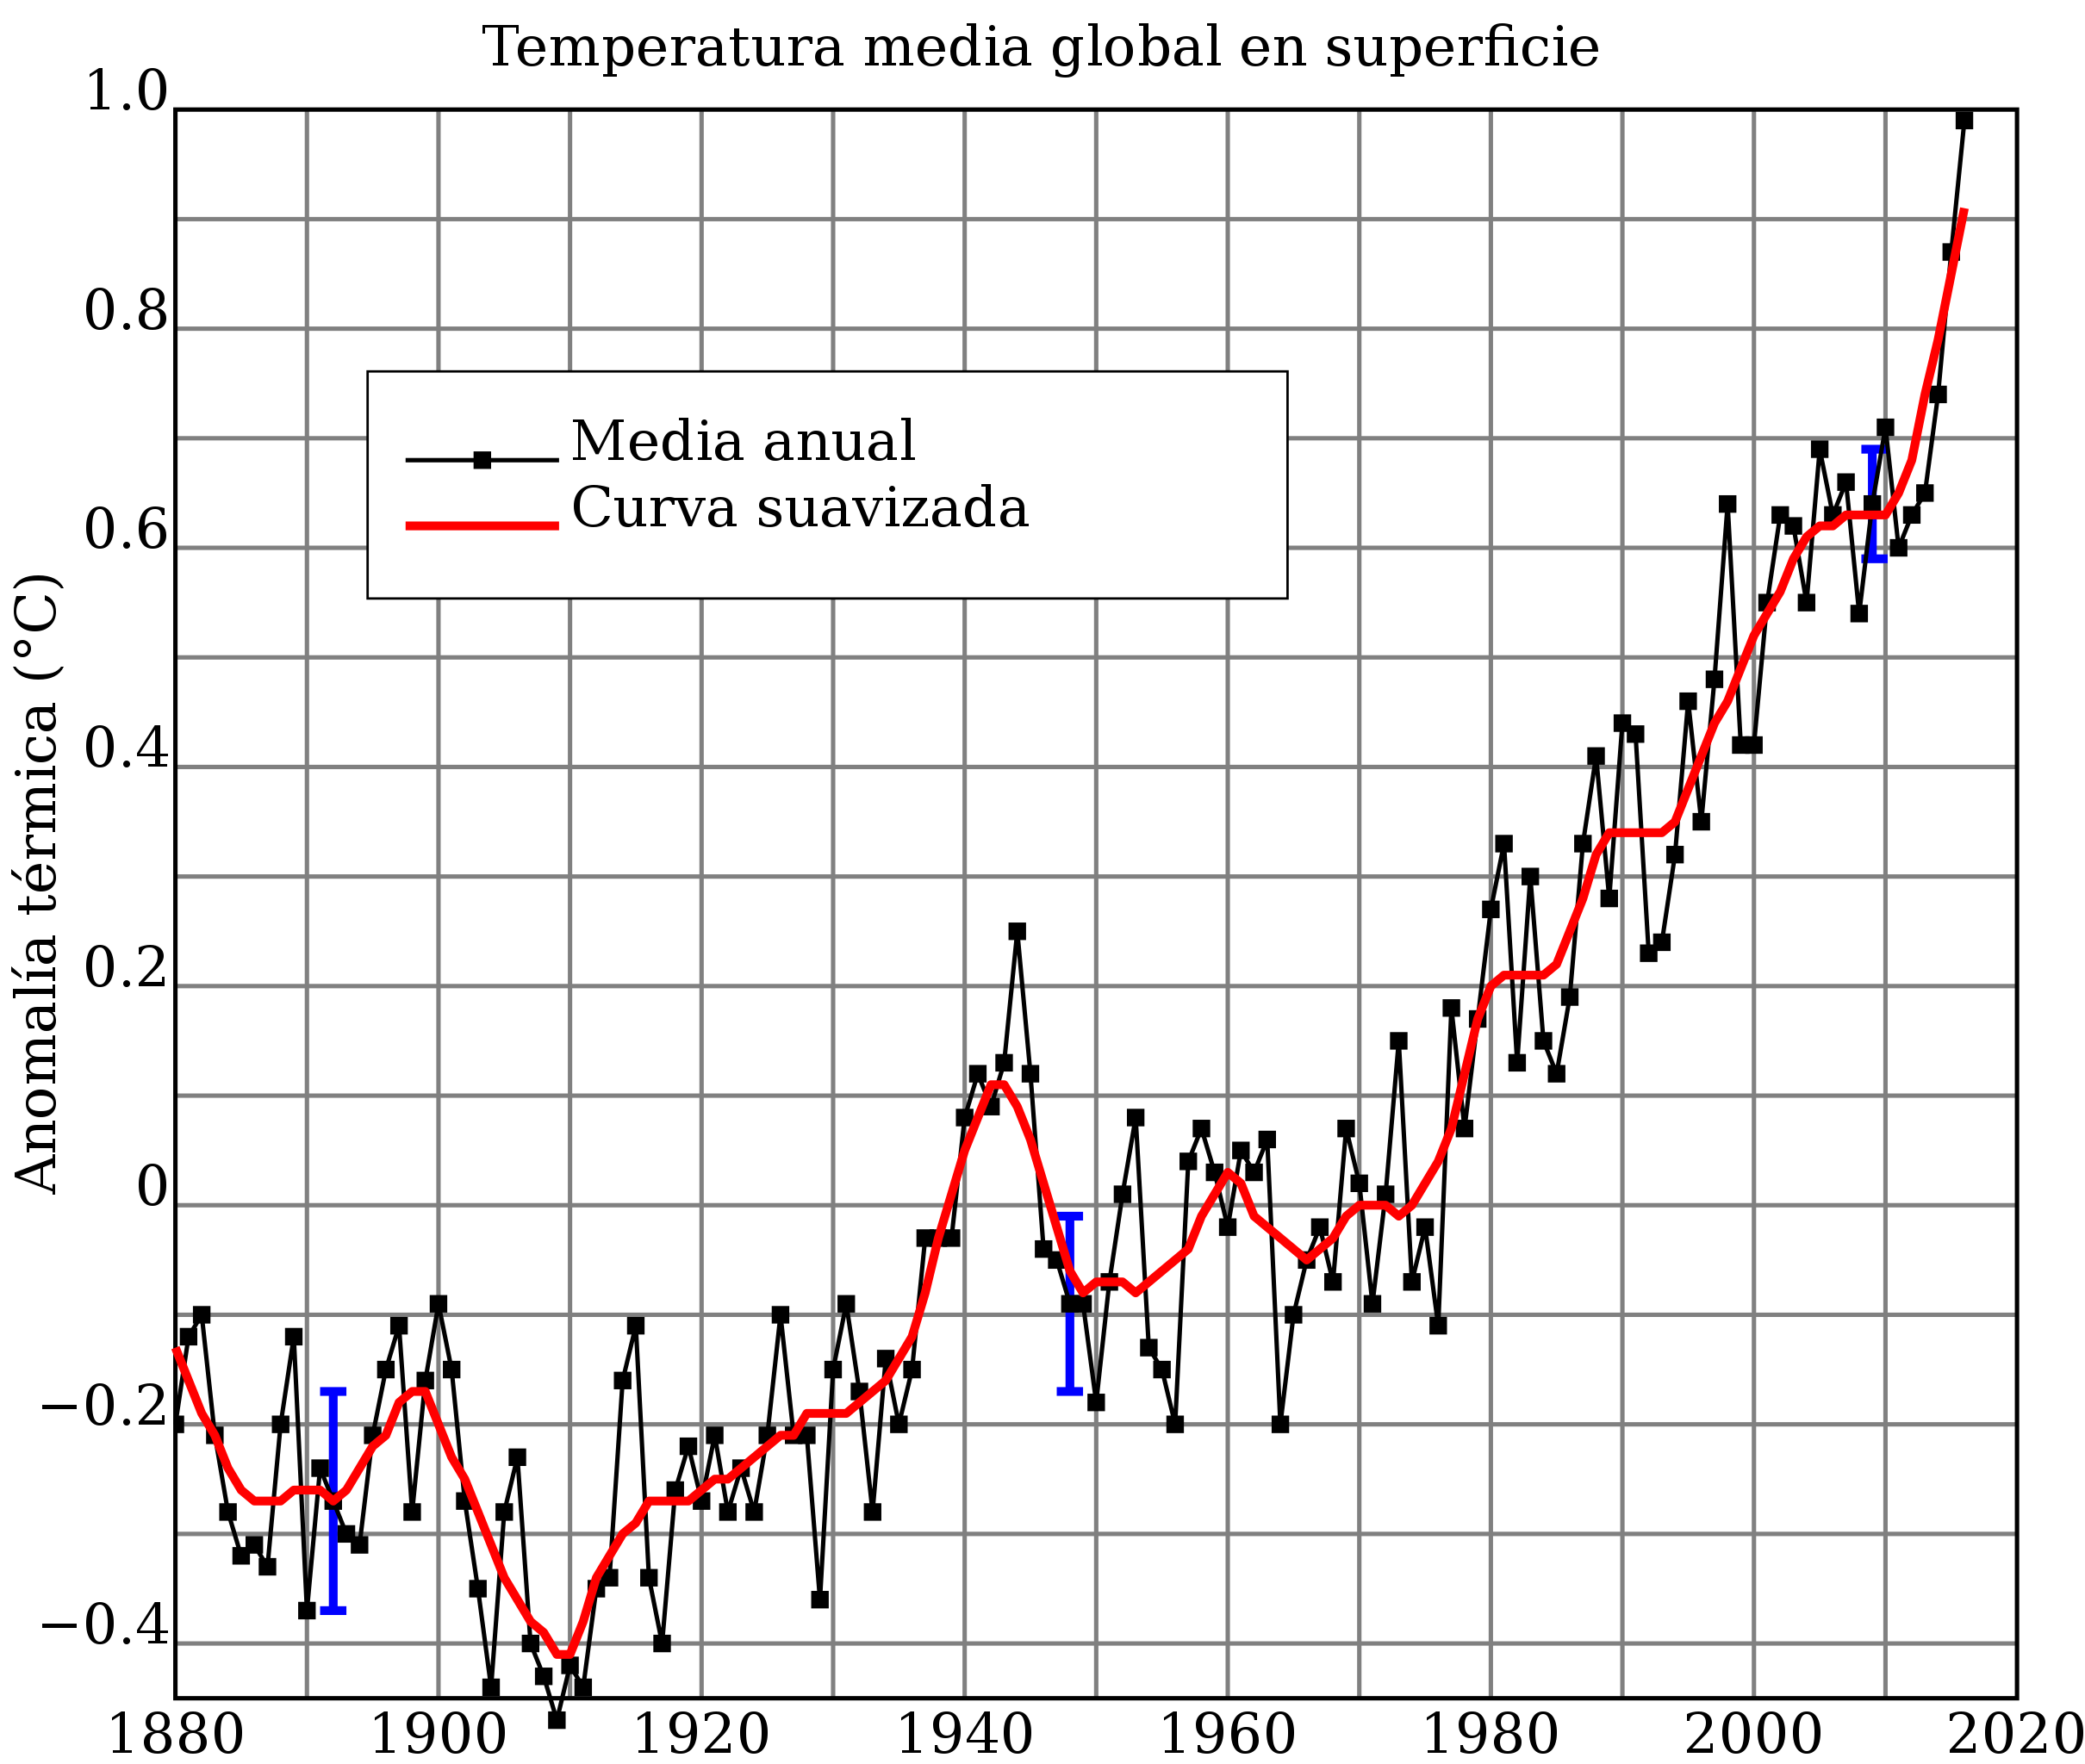
English: Line plot of global mean land-ocean temperature index, 1880 to present (2013), with the base period 1951-1980. Version in Spanish of the graph already in commons . Español: Índice de la temperatura media global, desde 1880 hasta la actualidad, con el período base 1951-1980. La línea negra sólida es la media global anual y la línea roja sólida es una curva suavizada con una regresión local no paramétrica basada en un modelo k vecino más cercano. La función se evalúa utilizando una parte de los datos correspondiente a un rango de diez años de datos, lo que resulta en un suavizado en la práctica de aproximadamente cinco años. Las barras azules representan la incertidumbre (límite de confianza del 95%) para el caso de observaciones espaciales incompletas. Esto se basa en la Fig. 1A en Hansen et al. (2006) y la Fig. 9a en Hansen et al. (2010). Gráfico actualizado con datos hasta 2016 procedentes de https://data.giss.nasa.gov/gistemp/graphs/. El gráfico muestra una tendencia global de calentamiento a largo plazo. |
| Date | |
| Source |
adaptation in Spanish on the basis of  |
| Author | Basquetteur |
| Other versions |
|
Licensing
edit
I, the copyright holder of this work, hereby publish it under the following license:
This file is licensed under the Creative Commons Attribution-Share Alike 4.0 International license.
- You are free:
- to share – to copy, distribute and transmit the work
- to remix – to adapt the work
- Under the following conditions:
- attribution – You must give appropriate credit, provide a link to the license, and indicate if changes were made. You may do so in any reasonable manner, but not in any way that suggests the licensor endorses you or your use.
- share alike – If you remix, transform, or build upon the material, you must distribute your contributions under the same or compatible license as the original.
File history
Click on a date/time to view the file as it appeared at that time.
| Date/Time | Thumbnail | Dimensions | User | Comment | |
|---|---|---|---|---|---|
| current | 06:14, 7 March 2017 | | 951 × 805 (32 KB) | Basquetteur (talk | contribs) | corrected mistake in terminology for curve in red |
| 17:20, 18 February 2017 |  | 951 × 805 (32 KB) | Basquetteur (talk | contribs) | box with legend inside graph did not render properly and text overflew over box | |
| 17:17, 18 February 2017 |  | 951 × 805 (31 KB) | Basquetteur (talk | contribs) | Updated with new more recent data from the original graph in English. Mofified translations of headings in Spanish also adapted, according to the IPCC Fifth Assessment Report in Spanish terminology | |
| 09:31, 31 January 2016 |  | 951 × 755 (30 KB) | Basquetteur (talk | contribs) | box of legend inside graphic does not seem to render properly | |
| 09:28, 31 January 2016 |  | 951 × 755 (30 KB) | Basquetteur (talk | contribs) | Update data and correct translation as requested by Hiperfelix | |
| 03:13, 17 June 2015 |  | 910 × 655 (66 KB) | Jarould (talk | contribs) | fix caption | |
| 03:09, 17 June 2015 |  | 910 × 655 (66 KB) | Jarould (talk | contribs) | fix superimposed subtitles | |
| 03:06, 17 June 2015 |  | 910 × 655 (71 KB) | Jarould (talk | contribs) | Updating | |
| 20:28, 25 December 2014 |  | 910 × 655 (49 KB) | Basquetteur (talk | contribs) | text to path to put object in proper place | |
| 20:17, 25 December 2014 |  | 910 × 655 (23 KB) | Basquetteur (talk | contribs) | User created page with UploadWizard |
You cannot overwrite this file.
File usage on Commons
There are no pages that use this file.
File usage on other wikis
The following other wikis use this file:
- Usage on ast.wikipedia.org
- Usage on es.wikipedia.org
- Usage on sc.wikipedia.org