File:Growth rate map of municipalities of Hokkaido, Japan.svg

Size of this PNG preview of this SVG file: 800 × 572 pixels. Other resolutions: 320 × 229 pixels | 640 × 458 pixels | 1,024 × 732 pixels | 1,280 × 915 pixels | 2,560 × 1,830 pixels.
Original file (SVG file, nominally 800 × 572 pixels, file size: 77 KB)
Captions
Captions
Add a one-line explanation of what this file represents
Summary
edit
| Description |
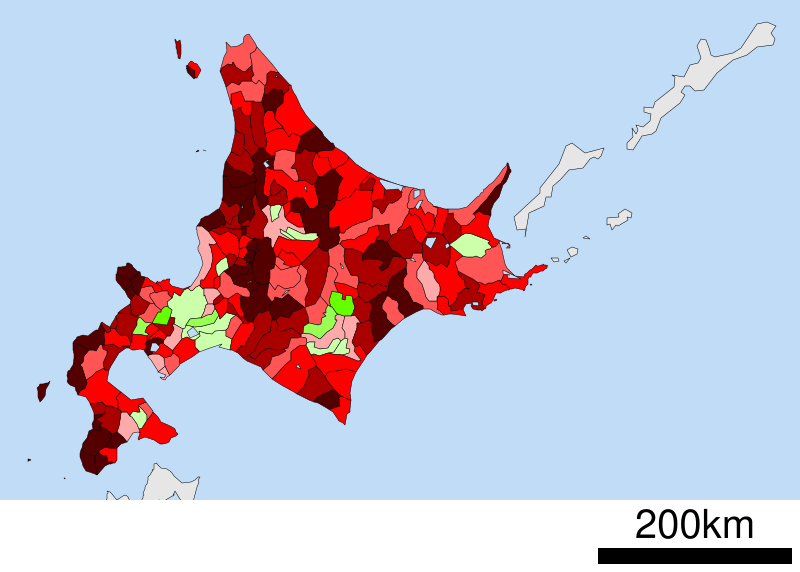
English: This chart is growth rate of municipalities of Aomori prefecture, Japan.It is estimated by census carried out in 2005 and 2010.
Increase 10.0 % and over
7.5 - 10.0 %
5.0 - 7.5 %
2.5 - 5.0 %
0.0 - 2.5 %
Decrease 0.0 - 2.5 %
2.5 - 5.0 %
5.0 - 7.5 %
7.5 - 10.0 %
10.0 % and below
日本語: 北海道市町村の人口増加率分布図(2005 - 2010年度国勢調査) |
| Date | |
| Source | File:Map of Hokkaido Prefecture Ja.svg by ja:利用者:Lincun |
| Author | User:Ow00wo |
| Permission (Reusing this file) |
seeblow |
Licensing
edit
This file is licensed under the Creative Commons Attribution-Share Alike 3.0 Unported license.
- You are free:
- to share – to copy, distribute and transmit the work
- to remix – to adapt the work
- Under the following conditions:
- attribution – You must give appropriate credit, provide a link to the license, and indicate if changes were made. You may do so in any reasonable manner, but not in any way that suggests the licensor endorses you or your use.
- share alike – If you remix, transform, or build upon the material, you must distribute your contributions under the same or compatible license as the original.
File history
Click on a date/time to view the file as it appeared at that time.
| Date/Time | Thumbnail | Dimensions | User | Comment | |
|---|---|---|---|---|---|
| current | 20:22, 5 May 2012 | | 800 × 572 (77 KB) | Ow00wo (talk | contribs) |
You cannot overwrite this file.
File usage on Commons
The following 2 pages use this file:
File usage on other wikis
The following other wikis use this file:
- Usage on ca.wikipedia.org
- Usage on de.wikipedia.org
- Usage on ja.wikipedia.org
- Usage on ko.wikipedia.org