File:HIV-timecourse-de.svg

Size of this PNG preview of this SVG file: 729 × 433 pixels. Other resolutions: 320 × 190 pixels | 640 × 380 pixels | 1,024 × 608 pixels | 1,280 × 760 pixels | 2,560 × 1,521 pixels.
Original file (SVG file, nominally 729 × 433 pixels, file size: 179 KB)
Captions
Captions
Add a one-line explanation of what this file represents
Summary edit
| Description |
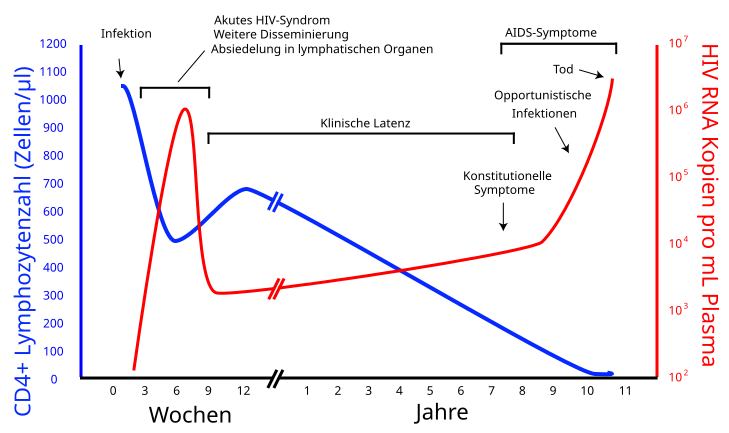
Deutsch: Zeitlicher Verlauf der HIV-Infektion bis zum Auftreten klinischer Symptome in Abhängigkeit von der T-Helferzellzahl.
English: Vectorized version of graph showing HIV viral load in relation to CD4+ lymphocyte count |
| Date | |
| Source |
This file was derived from: Hiv-timecourse copy.svg: |
| Author |
|
| Other versions |
[] SVG
PNG
|


.png)


.png)


| This is a retouched picture, which means that it has been digitally altered from its original version. Modifications: German translation with minor changes. The original can be viewed here: Hiv-timecourse copy.svg:
|
Licensing edit
I, the copyright holder of this work, hereby publish it under the following license:
| This file is made available under the Creative Commons CC0 1.0 Universal Public Domain Dedication. | |
| The person who associated a work with this deed has dedicated the work to the public domain by waiving all of their rights to the work worldwide under copyright law, including all related and neighboring rights, to the extent allowed by law. You can copy, modify, distribute and perform the work, even for commercial purposes, all without asking permission.
|
Original upload log edit
This image is a derivative work of the following images:
- File:Hiv-timecourse_copy.svg licensed with Cc-zero
- 2011-06-04T15:50:06Z RicHard-59 729x433 (183093 Bytes) Added timearea of AIDS-symptoms
- 2011-06-03T00:26:35Z Sigve 729x433 (175338 Bytes) added a line to the acute phase
- 2011-06-03T00:20:25Z Sigve 729x433 (175608 Bytes) converted to real SVG-format (instead of Adobe)
- 2011-06-03T00:18:27Z Sigve 729x433 (12194 Bytes)
Uploaded with derivativeFX
File history
Click on a date/time to view the file as it appeared at that time.
| Date/Time | Thumbnail | Dimensions | User | Comment | |
|---|---|---|---|---|---|
| current | 12:48, 2 September 2012 | | 729 × 433 (179 KB) | Furfur (talk | contribs) | == {{int:filedesc}} == {{Information |Description={{de|Zeitlicher Verlauf der HIV-Infektion bis zum Auftreten klinischer Symptome in Abhängigkeit von der T-Helferzellzahl.}} {{en|1=Vectorized version of graph showing HIV viral load in relation to CD4+... |
You cannot overwrite this file.
File usage on Commons
The following 24 pages use this file:
- File:HIV-timecourse-de.svg
- File:HIV-timecourse simple.svg
- File:Hiv-timecourse-Fr.png
- File:Hiv-timecourse-Fr 01.png
- File:Hiv-timecourse-IT.svg
- File:Hiv-timecourse-el.svg
- File:Hiv-timecourse-es.png
- File:Hiv-timecourse-fa.png
- File:Hiv-timecourse-kz.png
- File:Hiv-timecourse.png
- File:Hiv-timecourse (hy).png
- File:Hiv-timecourse ca.svg
- File:Hiv-timecourse copy.svg
- File:Hiv-timecourse copy be.svg
- File:Hiv-timecourse copy ku.svg
- File:Hiv-timecourse gl.svg
- File:Hiv-timecourse ja.png
- File:Hiv-timecourse ja.svg
- File:Hiv-timecourse ku.png
- File:Hiv timecourse (pt).png
- File:Verlauf einer HIV-Infektion.png
- File:Verlauf einer HIV-Infektion.svg
- File:Verlauf einer HIV Infektion1.svg
- Template:Other versions/HIV-timecourse