File:Hopfield 1.png
Size of this preview: 800 × 483 pixels. Other resolutions: 320 × 193 pixels | 640 × 386 pixels | 868 × 524 pixels.
Original file (868 × 524 pixels, file size: 97 KB, MIME type: image/png)
Captions
Captions
Add a one-line explanation of what this file represents
Summary
edit
| Description |
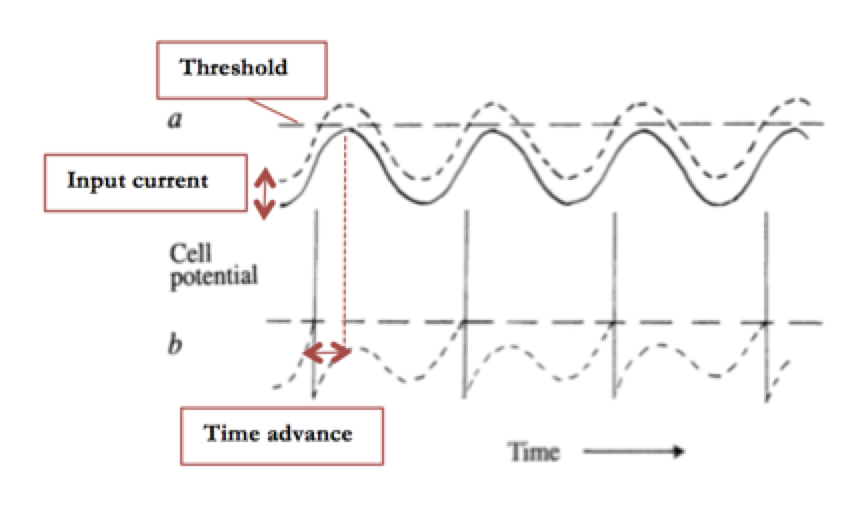
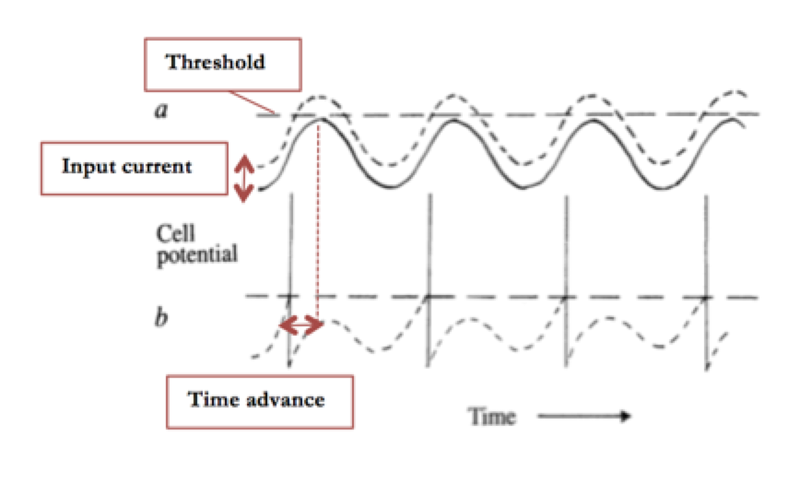
English: Fig. 2. Measuring input scale by action potential timing – a) shows the encoding neuron’s resting subthreshold oscillation in a solid line. Input currents alter the oscillation as shown by the dotted line, and thus make the encoding neuron reach its action potential threshold (depicted by the dashed straight line). In b) the dashed line still represents the encoding neuron’s action potential threshold. The dotted line shows the spiking behaviour of an encoding neuron upon a being stimulated by a threshold-reaching input. For both a) and b), the y-axis is voltage and the x-axis is time. Figure adapted from Hopfield, 1995. |
| Date | |
| Source | Adapted by permission from Macmillan Publishers Ltd: Hopfield. J. J. (1995) Pattern-recognition computation using action-potential timing for stimulus representation. Nature 376: 33-36, copyright (1995) |
| Author | John Hopfield |
Licensing
edit
This file is licensed under the Creative Commons Attribution 4.0 International license.
- You are free:
- to share – to copy, distribute and transmit the work
- to remix – to adapt the work
- Under the following conditions:
- attribution – You must give appropriate credit, provide a link to the license, and indicate if changes were made. You may do so in any reasonable manner, but not in any way that suggests the licensor endorses you or your use.
File history
Click on a date/time to view the file as it appeared at that time.
| Date/Time | Thumbnail | Dimensions | User | Comment | |
|---|---|---|---|---|---|
| current | 11:51, 13 July 2017 | | 868 × 524 (97 KB) | LaSerr (talk | contribs) | User created page with UploadWizard |
You cannot overwrite this file.
File usage on Commons
There are no pages that use this file.