File:Hurricane statistics.png

Size of this preview: 800 × 526 pixels. Other resolutions: 320 × 210 pixels | 640 × 421 pixels | 831 × 546 pixels.
Original file (831 × 546 pixels, file size: 31 KB, MIME type: image/png)
Captions
Captions
Add a one-line explanation of what this file represents
Summary edit
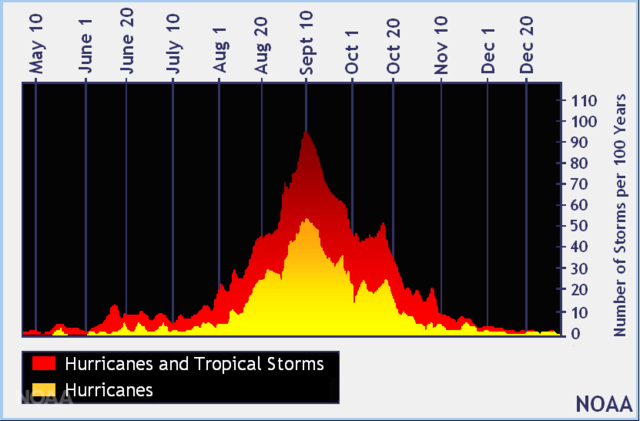
| Description |
English: This graphic shows the temporal distribution of tropical cyclones in the North Atlantic bassin. The number of tropical storm and hurricane days this basin (the Atlantic Ocean, the Caribbean Sea, and the Gulf of Mexico) jumps markedly by mid-August. |
| Date | |
| Source | http://www.noaa.gov/stories/peak-of-hurricane-season-why-now |
| Author | National Hurricane Center of the NOAA |
Licensing edit
This image is in the public domain because it contains materials that originally came from the U.S. National Oceanic and Atmospheric Administration, taken or made as part of an employee's official duties.
|
File history
Click on a date/time to view the file as it appeared at that time.
| Date/Time | Thumbnail | Dimensions | User | Comment | |
|---|---|---|---|---|---|
| current | 17:19, 3 September 2016 | | 831 × 546 (31 KB) | Pierre cb (talk | contribs) | {{Information |Description ={{en|1=This graphic shows the temporal distribution of tropical cyclones in the North Atlantic bassin. The number of tropical storm and hurricane days this basin (the Atlantic Ocean, the Caribbean Sea, and the Gulf of Mex... |
You cannot overwrite this file.
File usage on Commons
There are no pages that use this file.
File usage on other wikis
The following other wikis use this file:
- Usage on fr.wikipedia.org