File:Landkreis Muenchen Bevoelkerungsentwicklung.svg

Size of this PNG preview of this SVG file: 800 × 400 pixels. Other resolutions: 320 × 160 pixels | 640 × 320 pixels | 1,024 × 512 pixels | 1,280 × 640 pixels | 2,560 × 1,280 pixels.
Original file (SVG file, nominally 800 × 400 pixels, file size: 33 KB)
Captions
Captions
Add a one-line explanation of what this file represents
Summary
edit
| Description |
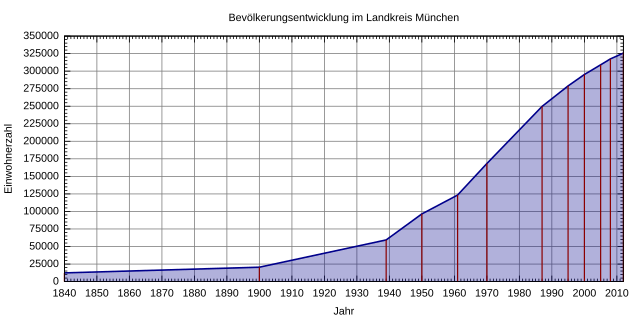
Deutsch: Bevölkerungsentwicklung im Landkreis München seit 1840. Datenquelle: [1] English: Population development in Landkreis Munich since 1840. Data source: [2] |
| Date | |
| Source | Own work |
| Author | Michael Fiedler |
Licensing
edit
I, the copyright holder of this work, hereby publish it under the following license:
This file is licensed under the Creative Commons Attribution-Share Alike 3.0 Unported license.
- You are free:
- to share – to copy, distribute and transmit the work
- to remix – to adapt the work
- Under the following conditions:
- attribution – You must give appropriate credit, provide a link to the license, and indicate if changes were made. You may do so in any reasonable manner, but not in any way that suggests the licensor endorses you or your use.
- share alike – If you remix, transform, or build upon the material, you must distribute your contributions under the same or compatible license as the original.
Gnuplot script to generate this plot
edit
#!/usr/bin/gnuplot
# gnuplot 4.6 / Debian 7
#
# Erstellt von Michael Fiedler <michael.fiedler87@gmx.de>
# Lizenz: CC-BY-SA 3.0 unported, https://creativecommons.org/licenses/by-sa/3.0/deed.de
# Basierend auf http://commons.wikimedia.org/wiki/File:Muc_population.svg von Gorgo

set title 'Bevölkerungsentwicklung im Landkreis München'
unset key
set style fill transparent solid 0.3
set grid

set xlabel 'Jahr'
set xrange [1840:2012]
# Jahreszahl alle 10 Jahre
set xtics 10
# nochmal unterteilen
set mxtics 10

set ylabel 'Einwohnerzahl'
# Beschriftungsintervall
set ytics 25000
# weitere Unterteilung ohne Beschriftung
set mytics 5
set yrange ['0':'350000']


set terminal svg size 800,400 font 'Arial,10'
set output 'Landkreis_Muenchen_Bevoelkerungsentwicklung.svg'

# '-' nimmt die nachfolgenden Daten als Eingabewerte
plot '-' using 1:2 with filledcurves below x1 linetype rgb 'dark-blue' linewidth 2, \
	    '-' using 1:2 with impulses linecolor rgbcolor 'dark-red' linewidth 1.5
# Datenquelle: http://de.wikipedia.org/wiki/Landkreis_München
	1840 12393
	1900 20521
	1939 59377
	1950 96475
	1961 123369
	1970 168336
	1987 249784
	1995 279007
	2000 295247
	2005 309080
	2008 317543
	2012 325744
EOF
	1840 12393
	1900 20521
	1939 59377
	1950 96475
	1961 123369
	1970 168336
	1987 249784
	1995 279007
	2000 295247
	2005 309080
	2008 317543
	2012 325744
EOF
File history
Click on a date/time to view the file as it appeared at that time.
| Date/Time | Thumbnail | Dimensions | User | Comment | |
|---|---|---|---|---|---|
| current | 18:31, 23 March 2014 | | 800 × 400 (33 KB) | Simified (talk | contribs) | User created page with UploadWizard |
You cannot overwrite this file.
File usage on Commons
There are no pages that use this file.
File usage on other wikis
The following other wikis use this file:
- Usage on de.wikipedia.org