File:Logistic curve overall view.png

Size of this preview: 800 × 596 pixels. Other resolutions: 320 × 238 pixels | 640 × 476 pixels | 1,024 × 762 pixels | 1,280 × 953 pixels | 2,740 × 2,040 pixels.
Original file (2,740 × 2,040 pixels, file size: 145 KB, MIME type: image/png)
Captions
Captions
Add a one-line explanation of what this file represents
Summary
edit| Description |
日本語: ロジスティック曲線の全体図
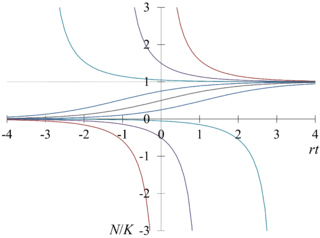
English: Overall view of logistic curve. The vertical axis is N/K, and the horizontal axis is rt. The curves were calculated from the equation
where, N is population, t is time, r is intrinsic rate of natural increase, K is carrying capacity. N0 is the value of N when t = 0. The value of N0/K for each curve is 10000, 1.5, 1.05, 0.75, 0.5, 0.25, -0.05, -0.5, and -9999 in order from the top. Putting y = N/K and x = rt, above equation may be written in the form
where, y0 is the value of y when x = 0. If y0 = 0.5,
|
| Date | |
| Source | Own work |
| Author | Yapparina |


Licensing
edit
I, the copyright holder of this work, hereby publish it under the following license:
| This file is made available under the Creative Commons CC0 1.0 Universal Public Domain Dedication. | |
| The person who associated a work with this deed has dedicated the work to the public domain by waiving all of their rights to the work worldwide under copyright law, including all related and neighboring rights, to the extent allowed by law. You can copy, modify, distribute and perform the work, even for commercial purposes, all without asking permission.
|
File history
Click on a date/time to view the file as it appeared at that time.
| Date/Time | Thumbnail | Dimensions | User | Comment | |
|---|---|---|---|---|---|
| current | 14:25, 21 December 2015 | | 2,740 × 2,040 (145 KB) | Yapparina (talk | contribs) | deleted frame line |
| 12:37, 21 December 2015 |  | 2,742 × 2,041 (151 KB) | Yapparina (talk | contribs) | User created page with UploadWizard |
You cannot overwrite this file.
File usage on Commons
There are no pages that use this file.
File usage on other wikis
The following other wikis use this file:
- Usage on ja.wikipedia.org