File:MDKQ1-no.svg

Size of this PNG preview of this SVG file: 378 × 288 pixels. Other resolutions: 315 × 240 pixels | 630 × 480 pixels | 1,008 × 768 pixels | 1,280 × 975 pixels | 2,560 × 1,950 pixels.
Original file (SVG file, nominally 378 × 288 pixels, file size: 33 KB)
Captions
Captions
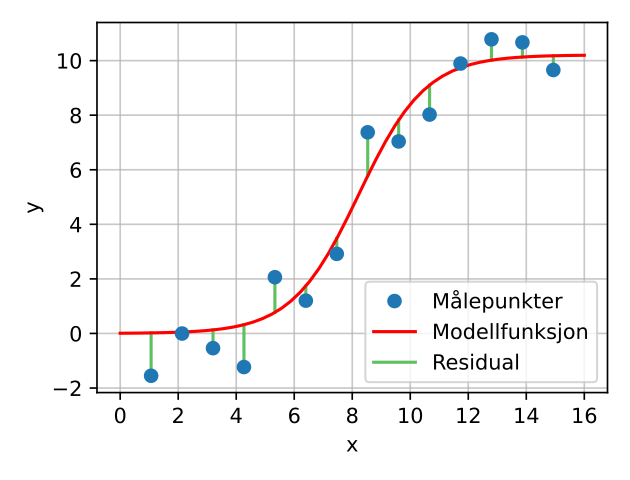
Fit a logistic function to measurementdata.
Summary
edit
| Description |
English: Logistical function adapted to a set of measurements. |
| Date | |
| Source | Own work based on: MDKQ1.svg by Christian Schirm, Own work using: Https: |
| Author | BFG |
| SVG development | This plot was created with Matplotlib. |
| Source code | Python code# This source code is public domain
import numpy, getopt, sys
import matplotlib.pyplot as plt
import matplotlib.ticker as ticker
from localize_py import Translator
def usage():
print ("""Usage is:\n\t %s [options] <filename>
Opions:
-l, --lang Language code
-h, --help This usage
""" % (sys.argv[0]))
try:
opts, args = getopt.getopt(sys.argv[1:], "hl:", ["help", "lang="])
except getopt.GetoptError as err:
# print help information and exit:
print(err) # will print something like "option -a not recognized"
usage()
sys.exit(2)
lang = 'de'
for o, a in opts:
if o in ("-h", "--help"):
usage()
sys.exit()
elif o in ("-l", "--lang"):
lang = a
print(a)
else:
assert False, "unhandled option"
fName=args[0]
Translator.load_translations(de='localization/de.json',no='localization/no.json')
_ = Translator(lang)
G=1
k=1
f0=0.5
x = numpy.linspace(-8,8,16)[1:-1]
numpy.random.seed(50)
y =numpy.random.normal(G/(1+numpy.exp(-k*G*x)*(G/f0-1)),0.1)
err=1E8
err=numpy.mean(numpy.square(y-G/(1+numpy.exp(-k*G*x)*(G/f0-1))))
print(err,G,k,f0)
numpy.random.seed(2)
for i in range(5000):
faktor=1+0.01*(numpy.random.rand()-.5)
for ivar in 1,2,3:
backup=[err,G,k,f0]
var=backup[:]
var[ivar]=var[ivar]*faktor
err,G,k,f0=var
err_neu = numpy.mean(numpy.square(y-G/(1+numpy.exp(-k*G*x)*(G/f0-1))))
if err_neu<err:
err=err_neu
else:
var[ivar]=backup[ivar]
err,G,k,f0=var
print(err,G,k,f0,"(%s)" % (_('Fehlerquadrat minimiert')))
xneu = numpy.linspace(-8,8,50)
yneu = G/(1+numpy.exp(-k*G*xneu)*(G/f0-1))
xr = x
yr = G/(1+numpy.exp(-k*G*xr)*(G/f0-1))
residuen = []
for i in range(len(x)): residuen +=[ [x[i]+8, x[i]+8],[y[i]*10, yr[i]*10], 'g-']
fig = plt.figure(figsize=(4.2, 3.2))
y0 = plt.plot(*residuen[:-3], color='#60c060', linewidth=1.5)
y0, = plt.plot(*residuen[-3:],label=_('Residuum'), color='#60c060', linewidth=1.5)
y2, = plt.plot(xneu+8,yneu*10,'r-',label=_('Modelfunktion'))
plt.setp(y2, linewidth=1.5)
y1, = plt.plot(x+8,y*10,'o',label=_('Messpunkte'))
plt.xlabel('x')
plt.ylabel('y')
order = y1,y2,y0
plt.legend(order,[p.get_label() for p in order],frameon=True, loc='lower right')
plt.gca().xaxis.set_major_locator(ticker.MultipleLocator(2))
plt.grid(True, alpha=0.7)
plt.tight_layout()
plt.savefig(fName)
|
Licensing
edit
I, the copyright holder of this work, hereby publish it under the following license:
| This file is made available under the Creative Commons CC0 1.0 Universal Public Domain Dedication. | |
| The person who associated a work with this deed has dedicated the work to the public domain by waiving all of their rights to the work worldwide under copyright law, including all related and neighboring rights, to the extent allowed by law. You can copy, modify, distribute and perform the work, even for commercial purposes, all without asking permission.
|
File history
Click on a date/time to view the file as it appeared at that time.
| Date/Time | Thumbnail | Dimensions | User | Comment | |
|---|---|---|---|---|---|
| current | 01:03, 28 November 2022 | | 378 × 288 (33 KB) | BFG (talk | contribs) | Uploaded own work with UploadWizard |
You cannot overwrite this file.
File usage on Commons
There are no pages that use this file.
File usage on other wikis
The following other wikis use this file:
- Usage on no.wikipedia.org