File:Maximum Power Transfer Graph.svg

Size of this PNG preview of this SVG file: 350 × 200 pixels. Other resolutions: 320 × 183 pixels | 640 × 366 pixels | 1,024 × 585 pixels | 1,280 × 731 pixels | 2,560 × 1,463 pixels.
Original file (SVG file, nominally 350 × 200 pixels, file size: 36 KB)
Captions
Captions
Add a one-line explanation of what this file represents
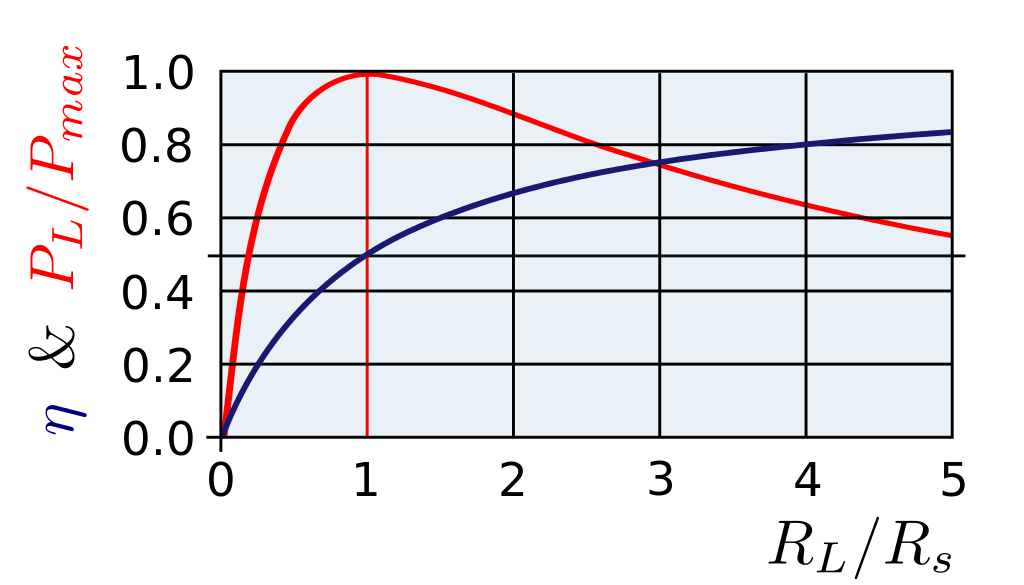
| Description | A graph to show the power dissipated in a resistive load (red line) supplied by a source with resistive effects. Also shown is the efficiency, η, (blue line) which is the proportion of the total power dissipated that is dissipated in the load resistance. | ||
| Date | 09/05/2007 | ||
| Source | Self Made in Inkscape and Mathematica | ||
| Author | Inductiveload | ||
| Permission (Reusing this file) |
|
File history
Click on a date/time to view the file as it appeared at that time.
| Date/Time | Thumbnail | Dimensions | User | Comment | |
|---|---|---|---|---|---|
| current | 20:17, 10 May 2007 | | 350 × 200 (36 KB) | Inductiveload (talk | contribs) | Made LaTeX axis labels |
| 18:31, 9 May 2007 |  | 350 × 200 (20 KB) | Inductiveload (talk | contribs) | {{Information |Description=A graph to show the power dissipated in a resistive load (red line) supplied by a source with resistive effects. Also shown is the efficiency, η, (blue line) which is the proportion of the total power dissipated that is diss |
You cannot overwrite this file.
File usage on Commons
The following page uses this file:
File usage on other wikis
The following other wikis use this file:
- Usage on en.wikipedia.org
- Usage on en.wikibooks.org
- Usage on fa.wikipedia.org
- Usage on hi.wikipedia.org
- Usage on it.wikipedia.org