File:Maximum likelihood tree of 17 populations including Mlabri.png

Size of this preview: 534 × 599 pixels. Other resolutions: 214 × 240 pixels | 428 × 480 pixels | 685 × 768 pixels | 1,200 × 1,346 pixels.
Original file (1,200 × 1,346 pixels, file size: 319 KB, MIME type: image/png)
File information
Structured data
Captions
Captions
Add a one-line explanation of what this file represents
| DescriptionMaximum likelihood tree of 17 populations including Mlabri.png |
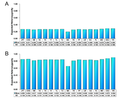
English: Maximum likelihood tree of populations and components. (A): Maximum likelihood tree of 17 populations, bootstrap values obtained by sampling 55,561 SNPs 100 times with replacements, only values less than 100 are shown. Colored population names (IDs) help recognize their linguistic affinities, yellow: Japonic, magenta: Sino-Tibetan, light-blue: Tai-Kadai, red: Austro-Asiatic. (B): Maximum likelihood tree of components inferred from STRUCTURE analysis (K = 8) Bootstrap values for B was obtained by randomly sampling cluster frequencies 100 times from STRUCTURE results.
A maximum likelihood tree of populations, based on 55,561 SNPs showed that Mlabri (MA) and Htin (TN) have the closest relationship, and this topology was supported by 100% of bootstrap replicates (Figure A). The component tree was reconstructed based on allele frequencies in each cluster inferred from the STRUCTURE analysis (Figure B). We found that the Mlabri specific and Htin specific component clustered tightly on the tree (supported by 100% of bootstrap replicates), strongly indicating once again that the Mlabri share a more recent ancestry with the Htin than with any other group in our sample. |
| Date | Published: 19 March 2010 |
| Source | Xu S, Kangwanpong D, Seielstad M, et al. Genetic evidence supports linguistic affinity of Mlabri - a hunter-gatherer group in Thailand. BMC Genetics. 2010;11:18. doi:10.1186/1471-2156-11-18. https://bmcgenet.biomedcentral.com/articles/10.1186/1471-2156-11-18 |
| Author | Shuhua Xu, Daoroong Kangwanpong, Mark Seielstad, Metawee Srikummool, Jatupol Kampuansai, Li JinEmail author and The HUGO Pan-Asian SNP Consortium |
| Other versions |
|
This file is licensed under the Creative Commons Attribution 2.0 Generic license.
|
This file was published in a BioMed Central journal. Their website states that all of its research publications is published under the license which is identical to the Creative Commons Attribution 2.0 license (some non-research articles like reviews or editorials may require a subscription.)
To the uploader: You must provide a link (URL) to the original file or journal article. English | 日本語 | македонски | +/− |
File history
Click on a date/time to view the file as it appeared at that time.
| Date/Time | Thumbnail | Dimensions | User | Comment | |
|---|---|---|---|---|---|
| current | 14:25, 18 May 2017 |  | 1,200 × 1,346 (319 KB) | 일성강 (talk | contribs) | fixed |
| 21:16, 25 January 2017 |  | 1,200 × 1,346 (265 KB) | Was a bee (talk | contribs) | {{Information |Description={{en|1=Maximum likelihood tree of populations and components. '''(A)''': Maximum likelihood tree of 17 populations, bootstrap values obtained by sampling 55,561 SNPs 100 times with replacements, only values less than 100 are... |
You cannot overwrite this file.
File usage on Commons
The following 6 pages use this file:
- File:Expected heterozygosity of Mlabri.png
- File:Geographical distribution of Thailand population samples.png
- File:Maximum likelihood tree of 17 populations including Mlabri.png
- File:Neighbor-Joining tree of Mlabri and others based on allele sharing distance.png
- File:PCA plot for 446 individuals representing 15 populations including Mlabri.png
- File:Population structure of Mlabri and others (inferred by STRUCTURE and frappe).png
Metadata
This file contains additional information such as Exif metadata which may have been added by the digital camera, scanner, or software program used to create or digitize it. If the file has been modified from its original state, some details such as the timestamp may not fully reflect those of the original file. The timestamp is only as accurate as the clock in the camera, and it may be completely wrong.
| Horizontal resolution | 37.8 dpc |
|---|---|
| Vertical resolution | 37.8 dpc |


