File:NASA’s Webb Spots Swirling, Gritty Clouds on Remote Planet (52764593578).jpg

Original file (3,840 × 2,356 pixels, file size: 391 KB, MIME type: image/jpeg)
Captions
Captions
Summary
edit.jpg&action=edit§ion=1)
| Description |
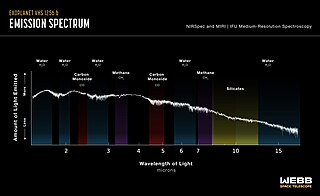
Sand…coarse, rough, gets everywhere. We may have found it on VHS 1256 b, a Tatooine-like world orbiting twin suns. Among other molecules, Webb detected silicate dust grains of varying sizes in its atmosphere. The larger grains may be like very hot, small sand particles. This spectrum is a bit like a barcode of Webb data. Elements and molecules present in the planet's atmosphere have signatures which scientists can read. Besides silicate clouds, this graph reveals signatures of water, carbon monoxide, methane and more. VHS 1256 b is about 40 light-years away and completes an orbit around its two stars every 10,000 (Earth) years. Despite the planet being 4 times farther from its stars than Pluto is from our Sun, the upper part of its atmosphere gets as hot as 1,500 degrees F (830 degrees C). The planet’s churning atmosphere constantly brings hotter material up and pushes colder material down over its 22-hour day, resulting in extremely dramatic brightness changes. In fact, VHS 1256 b is the most variable planetary-mass object known to date! No other telescope has ever identified so many features at once for a single target. With just a few hours of observations, Webb's provided enough for astronomers to keep learning about VHS 1256 b in the coming months and even years. Learn more: www.nasa.gov/feature/goddard/2023/nasa-s-webb-spots-swirl... Credits: Image: NASA, ESA, CSA, J. Olmsted (STScI); Science: Brittany Miles (University of Arizona), Sasha Hinkley (University of Exeter), Beth Biller (University of Edinburgh), Andrew Skemer (University of California, Santa Cruz) Image description: Graphic titled “Exoplanet VHS 1256 b Emission Spectrum.” The label at top right reads NIRSpec and MIRI, IFU Medium-Resolution Spectroscopy. Spectrum is plotted on a graph with y- and x-axes. On the y-axis, an arrow indicating less light emitted points down and a line indicating more light emitted points up. The x-axis has a log scale that ranges from just less than 2 microns to more than 15 microns. The graph shows jagged lines. Some are taller than others. Some jagged lines are stacked tightly together. From left to right (shorter to longer wavelength) there are labels for the following molecules: water (H2O), water, carbon monoxide (CO), water, methane (CH4), carbon monoxide, water, methane, silicates, and water. Silicates appear before and after the 10-micron mark. The silicates color looks more gold to the left of 10 microns. Where it overlaps with the water detection after 10 microns, it appears lighter and a bit greener. See the text description for more detail. |
| Date | |
| Source | NASA’s Webb Spots Swirling, Gritty Clouds on Remote Planet |
| Author | NASA's James Webb Space Telescope from Greenbelt, MD, USA |
Licensing
edit.jpg&action=edit§ion=2)
- You are free:
- to share – to copy, distribute and transmit the work
- to remix – to adapt the work
- Under the following conditions:
- attribution – You must give appropriate credit, provide a link to the license, and indicate if changes were made. You may do so in any reasonable manner, but not in any way that suggests the licensor endorses you or your use.
| This image was originally posted to Flickr by James Webb Space Telescope at https://flickr.com/photos/50785054@N03/52764593578. It was reviewed on 6 June 2023 by FlickreviewR 2 and was confirmed to be licensed under the terms of the cc-by-2.0. |
File history
Click on a date/time to view the file as it appeared at that time.
| Date/Time | Thumbnail | Dimensions | User | Comment | |
|---|---|---|---|---|---|
| current | 20:09, 6 June 2023 | | 3,840 × 2,356 (391 KB) | Astromessier (talk | contribs) | Transferred from Flickr via #flickr2commons |
You cannot overwrite this file.
File usage on Commons
There are no pages that use this file.
.jpg&oldid=881546268)