File:NEDC.language.multi.svg

Size of this PNG preview of this SVG file: 720 × 540 pixels. Other resolutions: 320 × 240 pixels | 640 × 480 pixels | 1,024 × 768 pixels | 1,280 × 960 pixels | 2,560 × 1,920 pixels.
Original file (SVG file, nominally 720 × 540 pixels, file size: 60 KB)
Captions
Captions
Add a one-line explanation of what this file represents
Summary
edit
| Description |
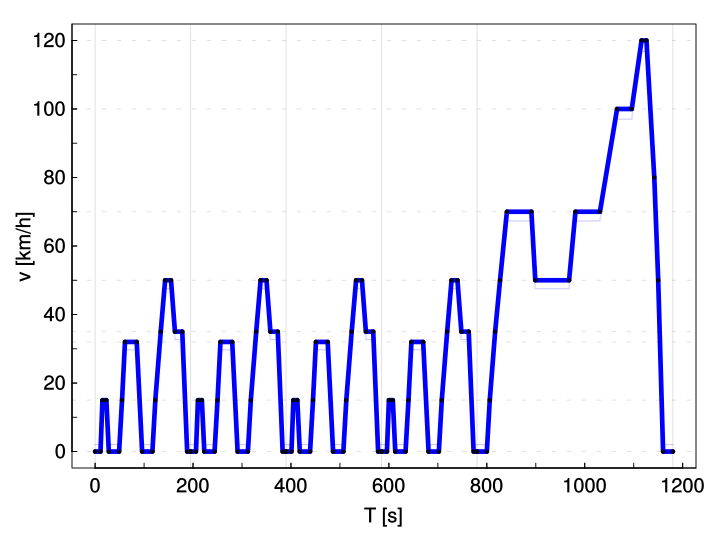
English: New European Driving Cycle. Velocity over time (driving profile). |
| Date | |
| Source | Own work |
| Author | HeWhoMowedTheLawn |
R source code
edit
nedc.R
#! /usr/bin/Rscript
# R-script for "New European Driving Cycle", "NEDC",
#             ("Neuer Europäischer Fahrzyklus", "NEFZ" [German])
# CC-BY-SA 4.0 2016 Frieder Ferlemann

# Data from
# R101r3e.pdf
# E/ECE/324/Rev.2/Add.100/Rev.3
# E/ECE/TRANS/505/Rev.2/Add.100/Rev.3
# Annex 7
dc_ece15 <- data.frame(matrix(c( 0,  0, #0
                                11,  0,
                                 4, 15,
                                 8, 15,
                                 5,  0,
                                21,  0, #5
                                 6, 15,
                                 6, 32,
                                24, 32,
                                11,  0,
                                21,  0, #10
                                 6, 15,
                                11, 35, # 35 km/h ~ 5 m height. Pedestrians
                                        # easily climb 5 m stairs within 17 s
                                 9, 50,
                                12, 50,
                                 8, 35, #15
                                15, 35, # decelerating to 37 km/h then
                                        # coasting to 33 km/h?
                                10,  0,
                                 7,  0
                                ), ncol=2, byrow=T))
colnames(dc_ece15) <- c("time", "speed")

# extra urban drive cycle
dc_eudc <- data.frame(matrix( c( 0,  0, #0
                                20,  0,
                                 6, 15,
                                11, 35,
                                10, 50,
                                14, 70, #5
                                50, 70,
                                 8, 50,
                                69, 50,
                                13, 70,
                                50, 70, #10
                                35,100, # 35 seconds from 70..100 km/h.
                                        # Certainly not real life.
                                30,100,
                                20,120,
                                10,120, # ~2.5% time with max speed of
                                        # 120 km/h. See above.
                                16, 80, #15
                                 8, 50,
                                10,  0,
                                20,  0
                                ), ncol=2, byrow=T) )
colnames(dc_eudc)  <- c("time", "speed")

# combining urban and extra urban drive cycles
dc <- rbind( dc_ece15,
             dc_ece15,
             dc_ece15,
             dc_ece15,
             dc_eudc )
# max speed of 120 km/h now for 10s/1180s ~= 0.8% of the drive cycle

# durations of the segments add up
dc$time_cum <- cumsum(dc$time)

svg("NEDC.language.multi.svg", width=8, height=6, pointsize=16)

par(las=1)                # label rotation
par(mgp=c(1.5, 0.25, 0))  # labels closer to plot
par(tcl=0.2)              # ticks
par("mar"=c(3, 3, 1, 1))  # smaller margins

# intentionally plain labels and no title to allow multi-language use
plot(dc$time_cum, dc$speed,
     type="l", lwd=5, col="blue",
     xlab="T [s]", ylab="v [km/h]" )
points( dc$time_cum, dc$speed, pch=16, cex=0.5, col="black" )

# add tolerances +-2km/h +-1% and +-1s (+-5s in some conditions)
col.tolerance="#0000ff20"
lines(dc$time_cum + 1, ifelse(dc$speed == 0, 1.01 * (dc$speed + 2), dc$speed), col=col.tolerance)
lines(dc$time_cum - 1, ifelse(dc$speed == 0, 1.01 * (dc$speed + 2), dc$speed), col=col.tolerance)
lines(dc$time_cum + 1, ifelse(dc$speed >= 2, 0.99 * (dc$speed - 2), dc$speed), col=col.tolerance)
lines(dc$time_cum - 1, ifelse(dc$speed >= 2, 0.99 * (dc$speed - 2), dc$speed), col=col.tolerance)
# "0.99 * (dc$speed - 2)" or "0.99 * dc$speed - 2"? (do not care)

abline(v = c( (0:4) * dc$time_cum[nrow(dc_ece15)], dc$time_cum[nrow(dc)] ), col="#00000020" )
abline(h = c( 0, 15, 32, 35, 50, 70, 100, 120 ), col="#00000020", lty="4c" )

axis(1, at=seq(0, 2000, 100), label=F)
axis(2, at=seq(0,  200,  10), label=F)

dev.off()

cat("Time", dc$time_cum[nrow(dc)], "s\n")
Similar file
edit
A similar diagram is available.

Licensing
edit
I, the copyright holder of this work, hereby publish it under the following license:
This file is licensed under the Creative Commons Attribution-Share Alike 4.0 International license.
- You are free:
- to share – to copy, distribute and transmit the work
- to remix – to adapt the work
- Under the following conditions:
- attribution – You must give appropriate credit, provide a link to the license, and indicate if changes were made. You may do so in any reasonable manner, but not in any way that suggests the licensor endorses you or your use.
- share alike – If you remix, transform, or build upon the material, you must distribute your contributions under the same or compatible license as the original.
File history
Click on a date/time to view the file as it appeared at that time.
| Date/Time | Thumbnail | Dimensions | User | Comment | |
|---|---|---|---|---|---|
| current | 20:48, 14 June 2016 | | 720 × 540 (60 KB) | HeWhoMowedTheLawn (talk | contribs) | User created page with UploadWizard |
You cannot overwrite this file.
File usage on Commons
The following page uses this file:
File usage on other wikis
The following other wikis use this file:
- Usage on de.wikipedia.org