File:Ncep meridionalvelanomalies 15n 700hpa.pdf

Size of this JPG preview of this PDF file: 800 × 353 pixels. Other resolutions: 320 × 141 pixels | 640 × 283 pixels | 1,024 × 452 pixels | 2,135 × 943 pixels.
Original file (2,135 × 943 pixels, file size: 5.78 MB, MIME type: application/pdf)
Captions
Captions
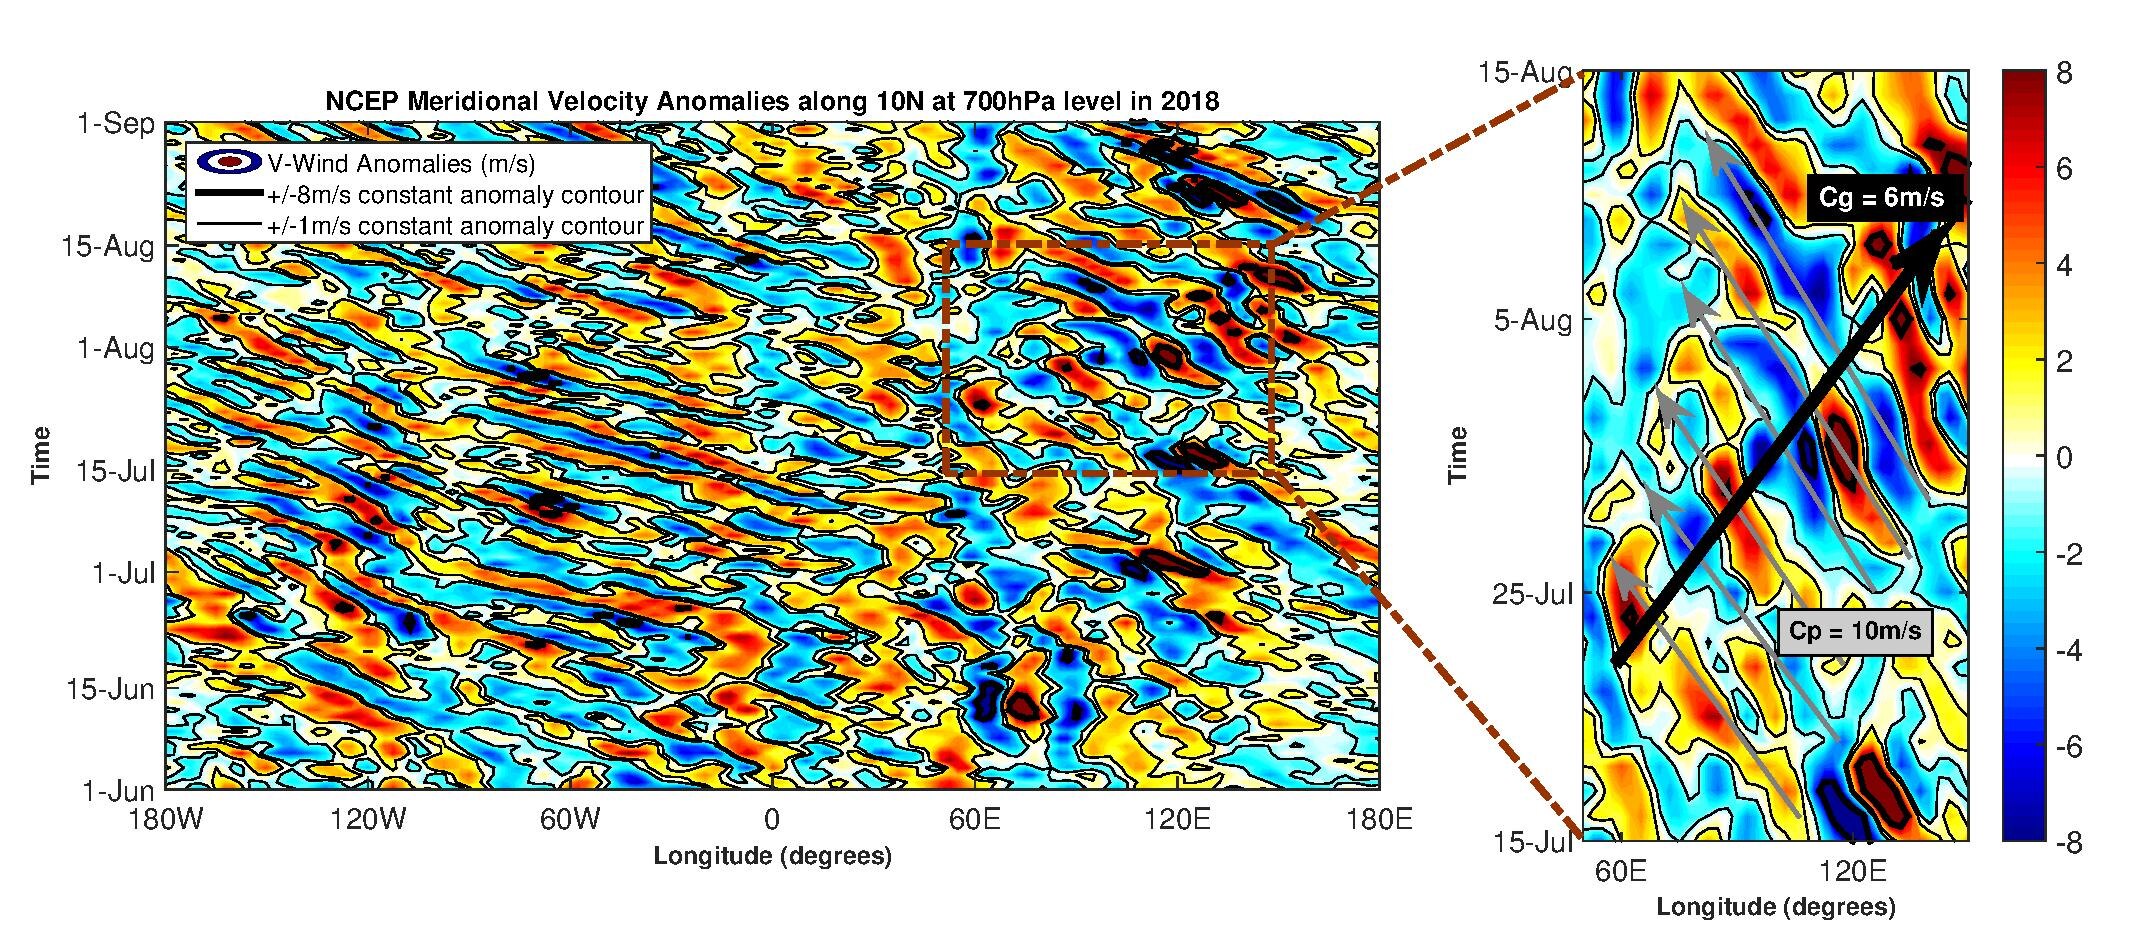
The Hovemöller diagram showing temporal evolution of NCEP/NCAR Reanalysis Meridional Wind Anoma- lies (in metres per second) at 700hPa pressure level along 10oN. The segment of the diagram from 50oE to 150oE is enlarged for detailed inspection.
Summary
edit| Description |
English: The Hovemöller diagram showing temporal evolution of NCEP/NCAR Reanalysis Meridional Wind Anomalies (in metres per second) at 700hPa pressure level along 10oN. The segment of the diagram from 50oE to 150oE is enlarged for detailed inspection. Grey colored arrows indicate phase propagation of signals in the westward direction and black colored arrow indicates the eastward propagation of the wave group. Cp and Cg represents the phase and
group velocities of waves respectively. |
| Date | |
| Source | Own work |
| Author | KIRAN S R |
arXiv:2103.09771
Licensing
editI, the copyright holder of this work, hereby publish it under the following license:
This file is licensed under the Creative Commons Attribution-Share Alike 4.0 International license.
- You are free:
- to share – to copy, distribute and transmit the work
- to remix – to adapt the work
- Under the following conditions:
- attribution – You must give appropriate credit, provide a link to the license, and indicate if changes were made. You may do so in any reasonable manner, but not in any way that suggests the licensor endorses you or your use.
- share alike – If you remix, transform, or build upon the material, you must distribute your contributions under the same or compatible license as the original.
File history
Click on a date/time to view the file as it appeared at that time.
| Date/Time | Thumbnail | Dimensions | User | Comment | |
|---|---|---|---|---|---|
| current | 14:51, 20 March 2021 |  | 2,135 × 943 (5.78 MB) | Sisira1999 (talk | contribs) | Uploaded own work with UploadWizard |
You cannot overwrite this file.
File usage on Commons
There are no pages that use this file.